
Market Overview
| Study Period | 2021 - 2031 |
|---|---|
| Forecast Data Period | 2026 - 2031 |
| Base Year Market Size (2025) | 387.75 kilotons |
| Market Volume (2026) | 397.13 kilotons |
| Market Volume (2031) | 447.57 kilotons |
| Growth Rate (2026 - 2031) | 2.42% CAGR |
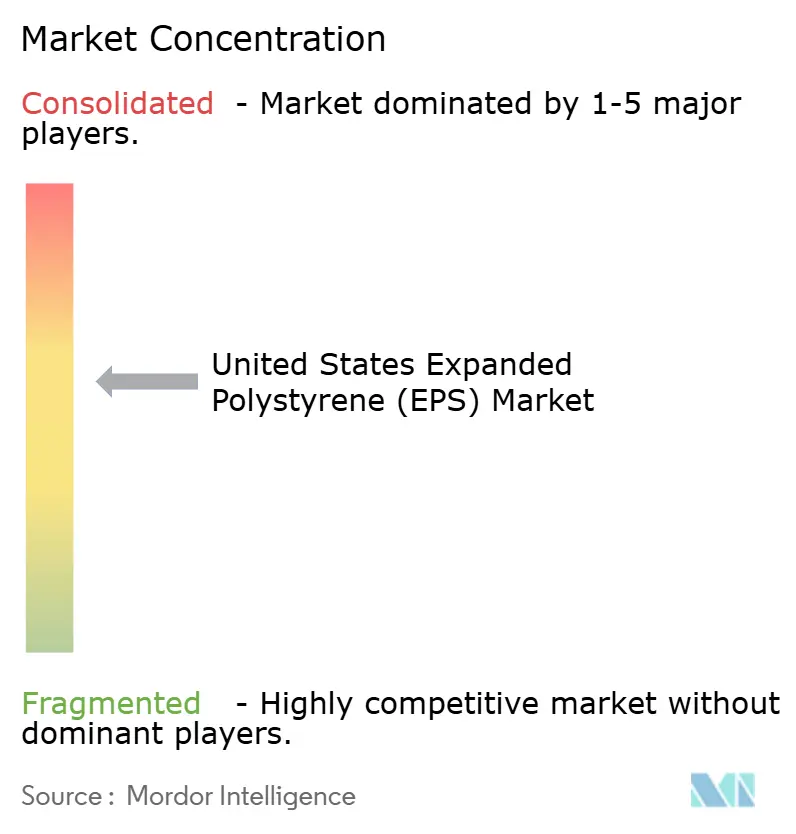
| Market Concentration | Medium |
Major Players *Disclaimer: Major Players sorted in no particular order Image © Mordor Intelligence. Reuse requires attribution under CC BY 4.0. | |
United States Expanded Polystyrene (EPS) Market Analysis by Mordor Intelligence
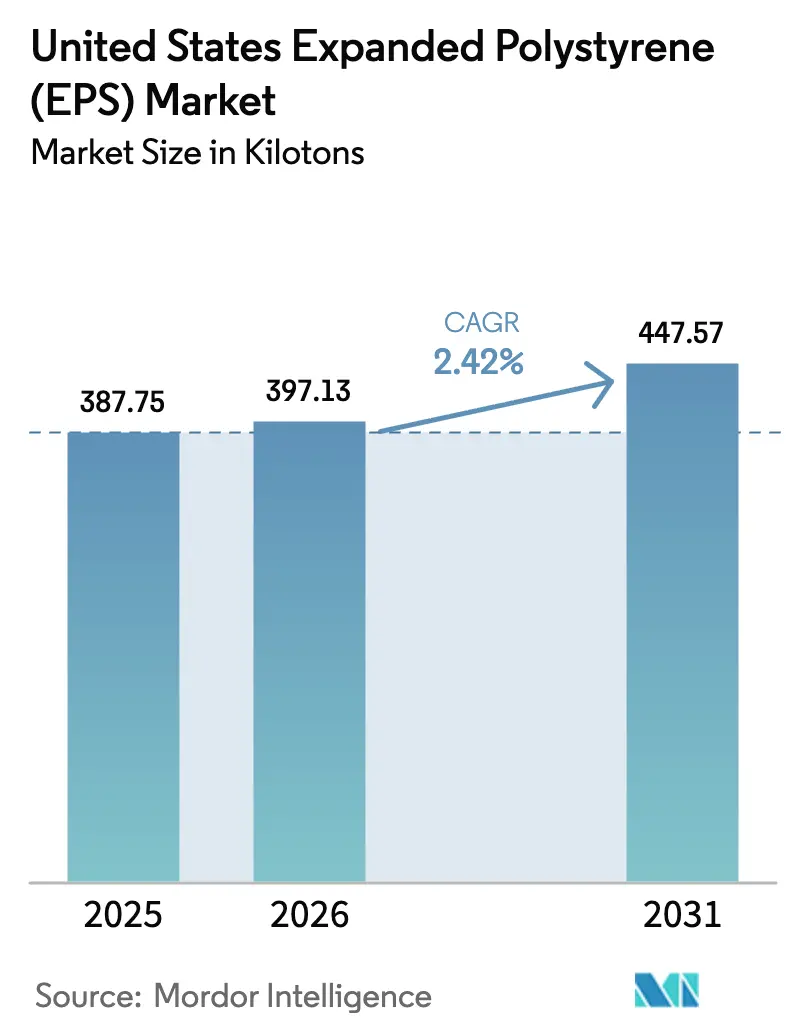
The United States Expanded Polystyrene Market size is projected to be 387.75 kilotons in 2025, 397.13 kilotons in 2026, and reach 447.57 kilotons by 2031, growing at a CAGR of 2.42% from 2026 to 2031. Federal energy-efficiency mandates that embed rigid foam into walls and roofs, continued growth in geofoam for civil works, and rising cold-chain logistics requirements all underpin steady volume gains, even as statewide bans on single-use foodware remove large blocks of packaging demand. Rapid expansion in semiconductor fabs and data centers is lifting below-slab geofoam consumption, while a 30% federal tax credit for insulation fosters retrofit activity across the nation’s 80 million pre-2000 single-family homes. At the same time, food-service prohibitions in California, New York, Washington, Oregon, and Delaware have stripped roughly 25% of disposable EPS volumes since 2022, compelling producers to pivot toward higher-value construction and cold-chain niches. Resin suppliers are pouring USD 185 million into recycled-content capacity to meet California’s upcoming minimums, signaling that circularity credentials will shape ordering decisions for molders and downstream brand owners.
Key Report Takeaways
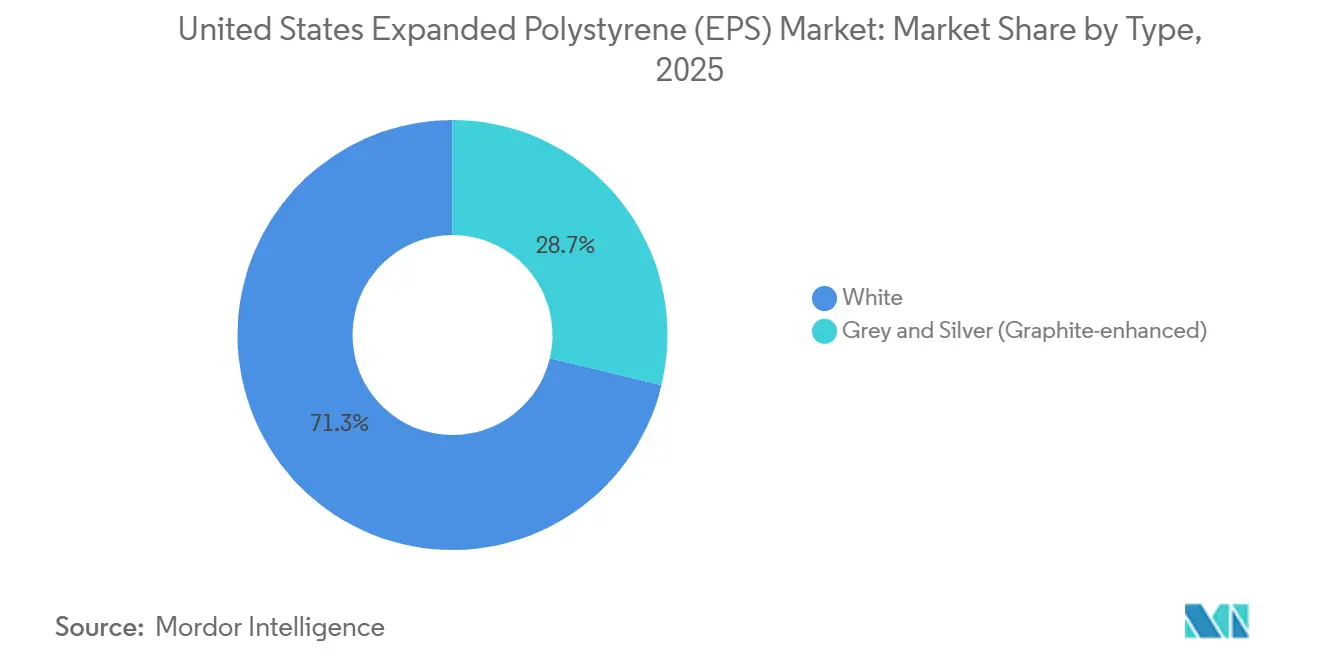
- By type, white grades commanded 71.25% of the expandable polystyrene market share in 2025, while graphite-enhanced grades are advancing at a 3.71% CAGR from 2026 to 2031.
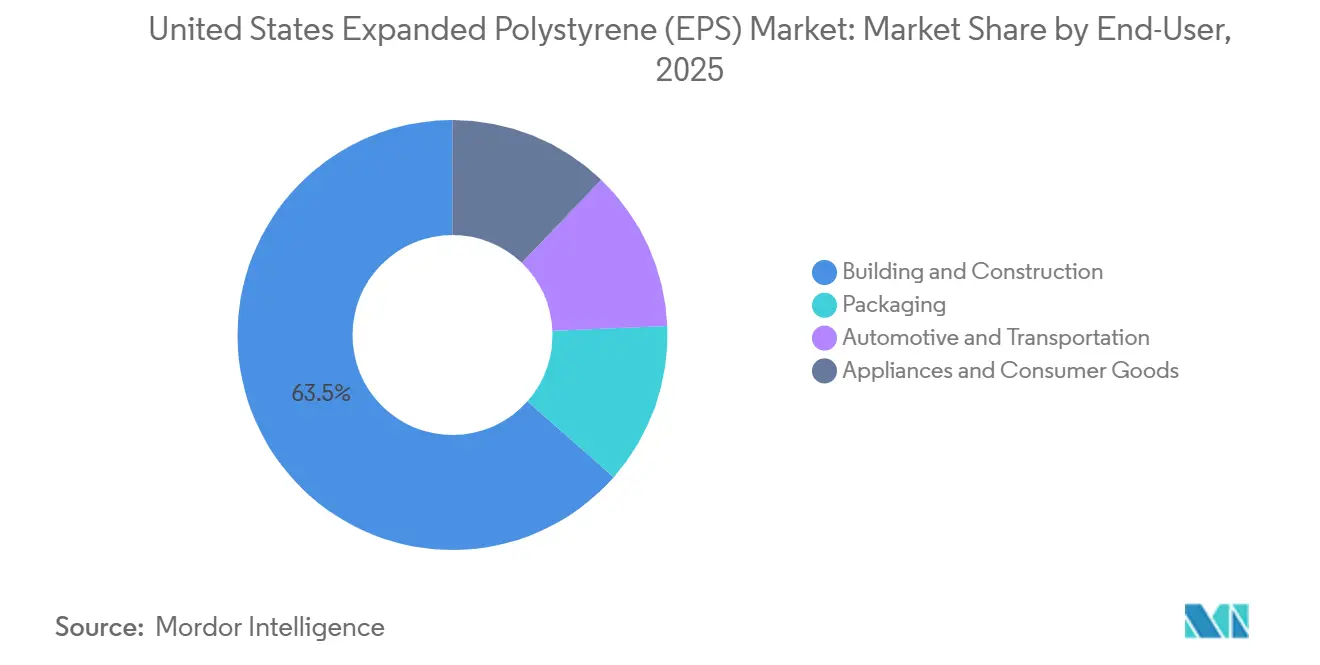
- By end-user, building and construction led with 63.50% revenue share in 2025, while packaging is forecast to post the fastest 3.18% CAGR through 2031.
Note: Market size and forecast figures in this report are generated using Mordor Intelligence’s proprietary estimation framework, updated with the latest available data and insights as of January 2026.
United States Expanded Polystyrene (EPS) Market Trends and Insights
Drivers Impact Analysis*
| Drivers | (~) % Impact on CAGR Forecast | Geographic Relevance | Impact Timeline |
|---|---|---|---|
| Construction-led insulation boom | +0.8% | Nationwide, climate zones 4-8 | Medium term (2-4 years) |
| E-commerce cold-chain expansion | +0.6% | Metro clusters with pharma hubs | Short term (≤ 2 years) |
| Federal energy-efficiency codes | +0.5% | Northeast and Pacific states | Long term (≥ 4 years) |
| Geofoam in climate-resilient civil works | +0.3% | Gulf Coast, Great Lakes | Medium term (2-4 years) |
| 3-D-printed graphite-EPS housing panels | +0.2% | Texas, Virginia, California pilots | Long term (≥ 4 years) |
| Source: Mordor Intelligence | |||


Construction-Led Insulation Boom
A 30% federal tax credit on insulation, capped at USD 1,200 per household through 2032, has accelerated attic, wall, and basement retrofits across the pre-2000 housing stock, unlocking new tonnage for the expandable polystyrene market[1]U.S. Department of Energy, “Inflation Reduction Act Tax Credits,” doe.gov. The International Energy Conservation Code 2024 and ASHRAE 90.1-2022 tightened U-factor limits for steel-frame walls, effectively mandating continuous insulating layers where EPS delivers R-4 per inch at installed costs below USD 0.50 per board foot[2]American Society of Heating, Refrigerating and Air-Conditioning Engineers, “Standard 90.1-2022,” ashrae.org. Although 2025 housing starts dipped 6% year-over-year, nonresidential construction value surged on semiconductor and data-center megaprojects, each specifying high-volume geofoam to curb settlement on soft soils. NREL estimates residential floor area will climb 38% and commercial floor area 37% by 2050, securing a multi-decade runway for rigid-foam demand. Contractors in cold regions are shifting toward graphite EPS, which boosts R-value 20-30%, enabling thinner panels that cut lumber costs and free interior space.
Exploding E-Commerce Cold-Chain Demand
Temperature-controlled logistics providers rely on EPS shippers that maintain 2 °C–8 °C for up to 72 hours at landed costs 40-60% below vacuum-insulated panels, a sizable advantage that sustains packaging volumes in the expandable polystyrene market. FedEx Temp-Assure and UPS Temperature True extended coverage to more than 200 U.S. metros in 2025, embedding cooler take-back loops at consolidation hubs for densification and reuse. Amazon’s grocery arm continues to deploy EPS boxes nationwide, although pilots of paper-composite coolers in California and Washington illustrate brand sensitivity in ban-active states. The Polystyrene Recycling Alliance plans to raise curbside access from 32% of the population to as high as 66% by 2030, yet contamination from food residues keeps most municipal programs on the sidelines. Even with these hurdles, pharmaceutical, seafood, and meal-kit shippers view EPS as the best cost-to-performance option for last-mile delivery in 2026.
Federal Energy-Efficiency Building Codes
The Department of Energy adopted IECC 2024 as the baseline for federal buildings, while the General Services Administration now requires all new facilities to meet net-zero-ready standards by 2030. Twenty-two states have mirrored or exceeded these codes, pushing builders toward exterior rigid foam in climate zones 4-8. EPS enjoys an edge over extruded polystyrene because it lacks hydrofluorocarbon blowing agents restricted under the American Innovation and Manufacturing Act. Homeowners leverage the 30% tax incentive to add 2 inches of EPS to basement walls, trimming heating loads by up to 25% in cold climates. State programs in New York, Massachusetts, and Illinois layer additional rebates on top, creating stacked incentives that improve payback periods to below four years for many retrofits.
Growing Usage of Geofoam for Climate-Resilient Civil Works
EPS geofoam lowers vertical stress on weak subgrades by 90% compared with compacted soil, a property that the Federal Highway Administration has documented in more than 20 states. A Texas DOT project on Interstate 10 cut construction costs by over 50% and slashed the schedule by six months through geofoam substitution for concrete fill. New York, Pennsylvania, and several Gulf Coast agencies now specify lightweight blocks beneath bridge approaches and retaining walls to combat settlement and future sea-level rise risks. Geofoam’s closed-cell structure resists freeze-thaw cycling, giving it a durability edge over lightweight cellular concrete in northern climates with intensive de-icing operations. These civil works wins keep geofoam a bright spot inside the expandable polystyrene market despite packaging headwinds.
Restraints Impact Analysis*
| Restraints | (~) % Impact on CAGR Forecast | Geographic Relevance | Impact Timeline |
|---|---|---|---|
| Biodegradable and paper-based substitutes | -0.4% | Coastal urban centers | Medium term (2-4 years) |
| State bans on single-use EPS foodware | -0.7% | CA, NY, WA, OR, DE | Short term (≤ 2 years) |
| EPA pentane-emission fee escalation | -0.3% | Gulf Coast resin hubs | Long term (≥ 4 years) |
| Source: Mordor Intelligence | |||
Biodegradable and Paper-Based Substitutes
Fiber-molded and mushroom-based packaging now lines Dell laptops and IKEA flat-packs, but costs remain 2-3 times higher than EPS and lead times stretch to two weeks because of biological growing cycles. Footprint International and Huhtamaki have invested heavily in fiber trays and clamshells, eyeing fast-food chains operating in ban-active states. Sigma-Aldrich’s paper-starch “Greener Cooler” claims identical thermal performance to 1.5-inch EPS walls, yet field trials found condensation failures in Gulf Coast humidity, highlighting performance gaps in extreme conditions. Construction and geofoam uses, where moisture resistance and compressive strength dominate selection criteria, face minimal threat from these bio-alternatives in 2026.
State Bans on Single-Use EPS Foodware
California’s Senate Bill 54 barred EPS cups and clamshells on January 1, 2025, after producers failed to hit a 25% recycling rate; enforcement remains light, but distributors are phasing out inventory to avoid future fines. New York’s ban already removed 12,000 tons of annual demand, and Washington, Oregon, and Delaware followed with similar restrictions during 2024-2025. Dart Container has retooled toward paper alternatives but still faces revenue pressure as 11 states now have phase-outs pending or active. Convenience-store associations advise members to exit foam well ahead of inspections, accelerating material switches that ripple through the expandable polystyrene market.
*Our forecasts treat driver/restraint impacts as directional, not additive. The impact forecasts reflect baseline growth, mix effects, and variable interactions.
Segment Analysis
By Type: Graphite Grades Gain as Codes Tighten R-Value Floors
White grades retained a 71.25% expandable polystyrene market share in 2025, anchored by costs near USD 0.40-0.50 per board foot and versatility in protective packaging, below-grade insulation, and geofoam. Graphite-enhanced versions deliver R-4.7-5 per inch, 20-30% higher than white, allowing builders in zones 5-8 to hit code with thinner walls - a benefit that offsets their 10-20% price premium. BASF’s Neopor leads supply, and European entrant BEWI reports its grey line outperforms white by roughly 20%, a gap that widens as temperatures drop.
The expandable polystyrene market size tied to graphite grades is projected to rise 3.71% CAGR through 2031 as adoption moves from commercial roofs into multifamily wall systems. White EPS will remain dominant in geofoam and standard packaging where compressive strength, moisture resistance, and delivered cost matter more than R-value. TxDOT’s Interstate 10 geofoam replacement saved over 50% versus concrete, underlining why thermal performance is irrelevant in many civil works. In cold-chain packaging, white coolers still beat graphite on cost even while meeting 48-72-hour hold times, limiting premium product penetration.

By End-User: Construction Anchors Volume While Packaging Drives Growth
Building and construction represented 63.50% of total consumption in 2025, reflecting deep penetration in foundation insulation, roof systems, and civil geofoam. The 30% tax credit, paired with stricter IECC and ASHRAE codes, maintains a steady pull for continuous insulation retrofits, while widening semiconductor and data-center pipelines lift geofoam orders under warehouse slabs. The expandable polystyrene market size for construction is forecast to advance at a 2.3% CAGR to 2031.
Packaging is projected to expand 3.18% CAGR, the fastest among end-users, even after bans erased one-quarter of single-use foam volumes. Cold-chain pharmaceuticals, fresh seafood, and meal-kit services keep order books healthy because EPS coolers deliver the lowest cost per protected liter. In 2025, reverse-logistics programs captured roughly 28 million coolers for densification, and logistics providers plan to double coverage by 2030.
Automotive applications use EPS in door panels and bumper cores for energy absorption, but expanded polypropylene—fully recyclable and tolerant of higher temperatures—continues to steal share. Appliances and consumer goods specify EPS when DOE efficiency standards allow thicker walls; upcoming 2029-2030 rules that encourage slimmer insulation may spur limited shifts toward higher-R foams or vacuum panels.

Geography Analysis
Regional adoption patterns reveal important nuances within the expandable polystyrene market. The Midwest and Northeast together consumed over 45% of national tonnage in 2025 because cold winters drive continuous-insulation demand, and the states in climate zones 5-7 enforce the most stringent R-value targets. Graphite EPS penetration exceeds 25% of wall-insulation sales in Minnesota, Wisconsin, and upstate New York, where thinner panels reduce framing-lumber volumes and simplify window jamb detailing.
The Pacific region accounted for just under 20% of the 2025 volume, with California alone representing 12%. While foodware bans curtailed packaging, Title 24 energy codes require substantial wall and roof insulation, supporting construction-grade EPS. California’s recycled-content mandate—30% in 2028—currently applies only to packaging, yet producers expect similar thresholds for building products, prompting resin suppliers to invest in mechanical-recycling lines in Los Angeles and the Bay Area.
The South and Southwest together consumed roughly one-third of tonnage in 2025, led by Texas, Florida, and Arizona. Rapid population growth sustains housing starts, and DOT agencies are major geofoam buyers for embankment and bridge projects. However, hotter climates lessen heating loads, so R-value gains from graphite grades are less financially compelling, keeping white EPS dominant. Gulf Coast resin plants also anchor local supply chains, reinforcing a cost advantage over extruded foams shipped from the Midwest.
Value Chain Analysis
The United States EPS value chain starts with upstream aromatics and styrene monomer supply feeding suspension polymerization to polystyrene, followed by EPS resin producers who impregnate beads with a blowing agent (commonly pentane) and additives (including graphite for higher-R insulation grades). Material then flows to regional molders and fabricators that pre-expand and mold beads into insulation boards (commonly made to ASTM C578 as referenced by the EPS Industry Alliance), geofoam blocks for civil works, and protective/cold-chain packaging; distribution is handled through building-material dealers and contractors for construction applications, and through temperature-controlled logistics providers and shippers for cold-chain packaging.
Key bottlenecks and value-add shifts are concentrated downstream in collection, densification, and reprocessing of post-use foam, where transport economics and inconsistent municipal acceptance historically constrained supply of recycled feedstock. Industry-led infrastructure is widening, with the Polystyrene Recycling Alliance (PSRA) reporting in June 2026 that 126 companies operate 169 facilities across 30 U.S. states (plus Canadian sites) actively processing or reclaiming polystyrene, and North American collection of EPS protective packaging reaching 206.2 million pounds in 2024 (up 22% since 2022). Take-back and on-site densification at distribution centers and consolidation hubs increasingly connect cold-chain users and recyclers directly, supporting recycled-content formulations that respond to state policy and brand-owner procurement requirements.
Competitive Landscape
Innovation and Sustainability Drive Future Success
The US expandable polystyrene market is moderately consolidated. Established players are solidifying their market positions by investing in advanced manufacturing technologies, developing eco-friendly product lines, and expanding recycling capabilities. At the same time, new entrants and smaller firms are identifying growth opportunities by targeting niche applications and delivering specialized solutions for specific end-user industries. The market's trajectory is being influenced by the growing adoption of circular economy principles and the rising demand for sustainable materials in packaging and construction.
However, businesses must address several challenges. The concentration of end-user industries in the construction and packaging sectors enhances buyer bargaining power. Additionally, the increasing availability of eco-friendly substitutes heightens the need for continuous product innovation and differentiation. Stricter regulatory requirements related to environmental impact and recycling are driving companies to adapt their product portfolios and manufacturing processes. To succeed in this evolving market, firms must balance innovation, sustainability, and operational efficiency while maintaining strong partnerships across the value chain.
United States Expanded Polystyrene (EPS) Industry Leaders
Alpek S.A.B. de C.V.
Epsilyte LLC
Dart Container Corp.
NexKemia Petrochemicals Inc.
BASF
- *Disclaimer: Major Players sorted in no particular order

Market Opportunities and Future Outlook
The clearest whitespace sits in verifiable circularity solutions that keep EPS in transport packaging and selected protective applications amid policy scrutiny. PSRA released 2026 evidence that EPS transport packaging achieved a 31% North American recycling rate and mapped a large processing ecosystem (including facilities making new transport packaging and other products from recovered EPS), providing a practical basis for expanding closed-loop programs with logistics operators, shippers, and material recovery partners. Localized collection models also broaden feedstock access where curbside participation is limited, as shown by the April 2026 installation of a foam collection and densification system in Nashville, Tennessee (PSRA with Foam Cycle and the Nashville Department of Waste Services).
On the product and go-to-market side, opportunities concentrate in higher-value grades and applications that are less exposed to single-use foodware bans: continuous insulation tied to tighter energy codes, and geofoam for civil works and large nonresidential slabs. Recycled-content and certified-claims offerings create differentiation in both packaging and construction supply chains, especially as buyers seek documentation that supports EPR compliance, minimum recycled content targets, and corporate material policies. At the same time, industry engagement with influential frameworks is becoming a commercial lever, highlighted by PSRA actions in 2026 to challenge the U.S. Plastics Pact classification of EPS transport and rigid polystyrene packaging as problematic, which directly affects brand-owner specifications and downstream demand visibility.
Recent Industry Developments
- May 2026: Epsilyte announced a USD 0.06 per pound price increase on all EPS grades effective May 1, 2026, citing rapidly changing feedstock costs. The move underscores continued raw-material volatility and the need for processors and converters to manage pricing and inventory planning across construction and packaging programs.
- October 2025: NexKemia implemented Coperion ZSK twin-screw extrusion technology to expand production capability for white and graphite-enhanced EPS and to run formulations containing up to 30% recyclate. The upgrade increases flexibility for higher-performance insulation grades and supports recycled-content offerings that are increasingly requested in procurement.
- February 2024: Epsilyte announced an EPS price increase citing rapidly changing feedstock costs. The action reinforced the sensitivity of EPS economics to styrene and energy inputs, influencing contract structures and surcharge mechanisms across packaging and building-material channels.


Research Methodology Framework and Report Scope
Market Definition and Coverage
For this study, the market covers expandable polystyrene (EPS) used in the United States, counted as demand for EPS material supplied to downstream uses like insulation, protective packaging, and other molded applications.
Scope exclusions: We exclude other polymer foams and finished goods value add beyond EPS material (for example, non-EPS insulation materials and non-EPS packaging substitutes).
Segmentation Overview
- By Type
- White
- Grey and Silver (Graphite-enhanced)
- By End-User
- Building and Construction
- Packaging
- Automotive and Transportation
- Appliances and Consumer Goods
Data Validation & Update Cycle
Outputs were checked through several steps so the totals stay consistent with real-world signals. We compared the model results against independent indicators such as construction activity, trade movement, and known shifts in insulation specifications, and then outliers were reviewed before the final numbers were signed off.
If a big variance showed up, respondents were re-contacted to confirm whether it was a one-time event or a real market change that should flow into the base year. Reports are refreshed annually, and interim updates are made when material events happen, such as major capacity changes or sudden demand shocks. Before delivery, an analyst runs a fresh review pass so clients receive the most current view available.
Mordor Intelligence's United States Expandable Polystyrene Eps Market Sizing Compared With Other Published Estimates
It is normal to see different market sizes published for US EPS because the studies do not always measure the same thing, even if they use similar titles. Differences usually come from unit choice (volume versus value), what is counted as EPS versus adjacent materials, and how quickly pricing assumptions are refreshed.
Some external estimates present a revenue figure that can blend in downstream conversion value or apply aggressive price growth over the forecast window, and that alone can move the number a lot. Mordor Intelligence reports this market on a volume basis in kilotons and keeps the scope tied to EPS material demand, which avoids mixing in non-EPS foams and unrelated fabricated product value.
Benchmark comparison
| Source | Market Size | Gaps in Research Methodology |
|---|---|---|
| Mordor Intelligence | USD 0.40 M (2026) | |
| Industry Publisher A | USD 1.25 B (2024) | Value-based sizing can rise quickly if assumed EPS pricing and downstream conversion value are blended, and the base year and inflation path are not clearly tied back to EPS resin-to-foam economics. |
| Industry Publisher B | USD 1.89 B (2026) | The estimate is expressed in USD and can reflect broader inclusion around EPS applications and form-factor value add, which makes it hard to reconcile directly to an EPS material consumption total in volume terms. |
The table shows that the main spread is driven less by demand disagreement and more by measurement choices, especially volume versus value and how much downstream value is included. By keeping the inputs traceable to consumption signals and separating mix and price effects in simple steps, the results stay easier to repeat and compare over time.


Key Questions Answered in the Report
How large is the expandable polystyrene market in the United States today?
The expandable polystyrene market size reached 397.13 kilotons in 2026 and is forecast to hit 447.57 kilotons by 2031.
What is the main growth driver for U.S. EPS demand?
Tightening federal and state energy-efficiency codes that require continuous insulation in walls and roofs are the primary catalyst, lifting construction volumes.
Which EPS type is gaining share the fastest?
Graphite-enhanced grades are growing at a 3.71% CAGR because their higher R-value allows builders to meet code with thinner panels.
How are state foodware bans affecting EPS producers?
Bans in five states already removed about 25% of single-use packaging demand, pushing producers to focus on cold-chain, construction, and geofoam outlets.
What role does recycling play in the EPS outlook?
California’s escalating recycled-content mandates have sparked USD 185 million in new capacity, positioning compliant suppliers for future procurement advantages.
Page last updated on:






