
Market Overview
| Study Period | 2021 - 2031 |
|---|---|
| Forecast Data Period | 2026 - 2031 |
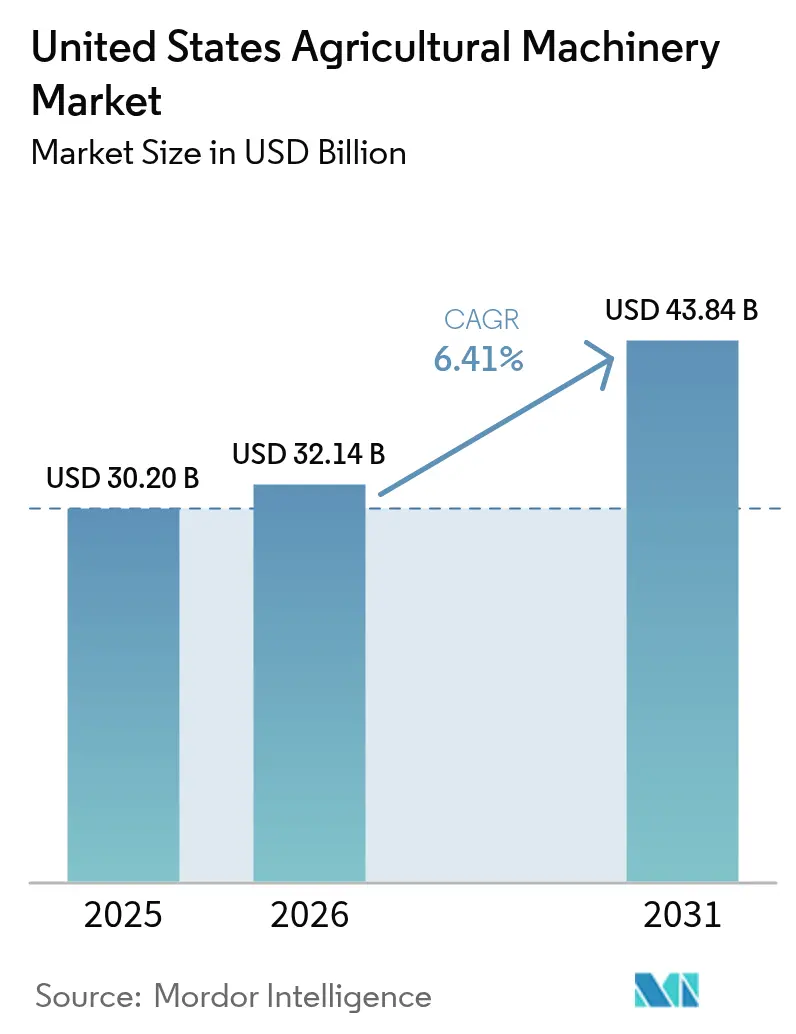
| Base Year Market Size (2025) | USD 30.20 Billion |
| Market Size (2026) | USD 32.14 Billion |
| Market Size (2031) | USD 43.84 Billion |
| Growth Rate (2026 - 2031) | 6.41% CAGR |
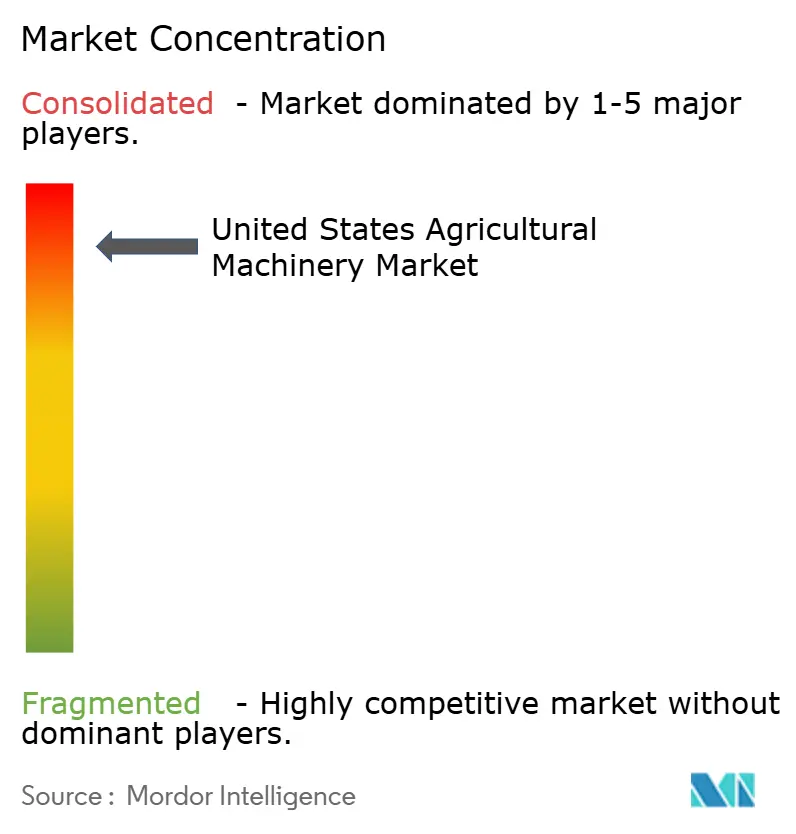
| Market Concentration | High |
Major Players *Disclaimer: Major Players sorted in no particular order Image © Mordor Intelligence. Reuse requires attribution under CC BY 4.0. | |
United States Agricultural Machinery Market Analysis by Mordor Intelligence
The United States agricultural machinery market size was valued at USD 30.2 billion in 2025 and estimated to grow from USD 32.14 billion in 2026 to reach USD 43.84 billion by 2031, at a CAGR of 6.41% during the forecast period (2026-2031). Federal incentives for climate-smart practices, precision technology retrofits, and electrification investments help counterbalance cyclical market fluctuations. Equipment owners focus on upgrading capabilities to reduce operational costs and achieve sustainability goals, increasing demand for telematics, predictive maintenance, and autonomous-ready systems. Dealer consolidation improves after-sales service networks, while leasing and subscription options help mitigate the impact of higher interest rates. The irrigation segments demonstrate higher growth rates in the United States agricultural machinery market, driven by increasing water scarcity and stricter emissions regulations.
Key Report Takeaways
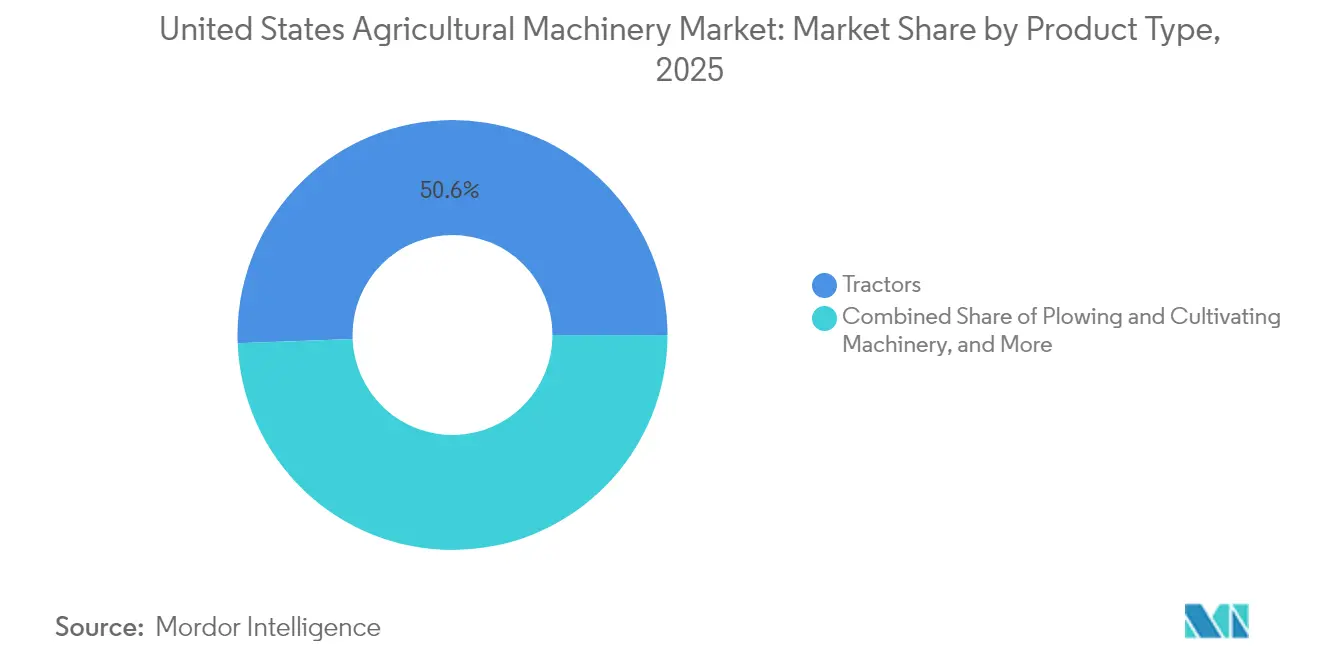
- By product type, tractors held 50.62% of the United States agricultural machinery market share in 2025, and irrigation machinery is projected to expand at a 9.26% CAGR through 2031.
- By farm size, the 500–2,000-acre segment commanded a 42.48% share of the market size in 2025, and farms under 500 acres are advancing at an 7.96% CAGR to 2031.
Note: Market size and forecast figures in this report are generated using Mordor Intelligence’s proprietary estimation framework, updated with the latest available data and insights as of 2026.
United States Agricultural Machinery Market Trends and Insights
Drivers Impact Analysis*
| Driver | (~) % Impact on CAGR Forecast | Geographic Relevance | Impact Timeline |
|---|---|---|---|
| Widespread adoption of precision-ag retro-fit kits | +1.5% | Midwest corn belt first adopters, now national | Medium term (2-4 years) |
| Electrification road-maps by major original equipment manufacturers | +1.1% | California and Northeast lead | Long term (≥ 4 years) |
| Rising adoption of telematics-based predictive maintenance | +1.0% | Adoption highest on large operations | Short term (≤ 2 years) |
| Climate-smart grant incentives | +0.8% | Conservation priority areas nationwide | Medium term (2-4 years) |
| Surge in bespoke equipment leasing models | +0.9% | Most pronounced on cash-constrained farms | Short term (≤ 2 years) |
| Venture-backed robotics start-ups targeting specialty crops | +0.7% | West Coast and Southeast orchards and vineyards | Long term (≥ 4 years) |
| Source: Mordor Intelligence | |||


Widespread Adoption of Precision-Ag Retro-Fit Kits
Retro-fit solutions enable farmers to extend their existing fleet's lifespan while reducing fertilizer and pesticide usage by up to 30% through data-driven improvements. The investment of USD 50,000 per tractor for retrofitting is significantly lower than the USD 400,000 required for new autonomous-ready equipment, typically resulting in a return on investment within three years. Mid-scale row-crop farms increasingly adopt these solutions to maintain cost competitiveness without increasing debt. Equipment dealers benefit from additional service revenue through installation and calibration of retrofit kits, which strengthens customer relationships and improves profitability. The growing adoption of modular upgrades extends equipment replacement cycles, causing Original Equipment Manufacturers (OEMs) to shift their focus from unit sales to software and integration services.
Electrification Road-Maps by Major Original Equipment Manufacturers
Deere & Company plans to launch its first all-electric, autonomous-capable tractor in 2026 and has invested in Kreisel Electric for battery supply. AGCO introduced the Fendt e100 Vario to pilot fleets in 2024, supported by a 60% increase in research and development spending focused on electric powertrains. Current battery density limits electric tractors to under-120-horsepower applications, which align with the requirements of fruit, vegetable, and dairy farms. The Natural Resources Conservation Service (NRCS) offers cost-share programs that can cover over 50% of purchase costs, reducing financial barriers for small farms. While manufacturers expect future battery technology improvements to enable higher-horsepower applications, current progress has encouraged component suppliers to expand United States battery and inverter production.
Rising Adoption of Telematics-Based Predictive Maintenance
Connected diagnostics reduce unplanned downtime by 30% and enable remote resolution of 25% of service tickets, reducing fuel consumption and labor requirements for dealerships experiencing staff shortages. Partnerships between OEMs and satellite providers, including Starlink and Intelsat, expand coverage to areas without 5G infrastructure, addressing a key adoption barrier. While large operators initially realize greater returns due to economies of scale, leasing agreements with bundled subscription packages make the technology more accessible to smaller farms. The predictive data collected also enhances OEM product development, enabling faster improvements to components with high failure rates and software updates.
Climate-Smart Grant Incentives
The United States Department of Agriculture (USDA) allocated USD 1.5 billion in 2024 through the Regional Conservation Partnership Program to reimburse practices that reduce emissions and enhance soil health[1] USDA, “Investing in America Agenda – Climate Smart Agriculture Funding,” usda.gov. The Rural Energy for America Program (REAP) supports on-farm renewable energy implementation, complementing electric and telemetry-equipped machinery that validates carbon reduction outcomes. Equipment vendors that demonstrate quantifiable environmental benefits experience improved sales forecasts, as grant approvals increasingly depend on measurable outcomes.
Restraints Impact Analysis*
| Restraint | (~) % Impact on CAGR Forecast | Geographic Relevance | Impact Timeline |
|---|---|---|---|
| Dealer technician shortage | -0.9% | National, with acute impacts in rural areas | Short term (≤ 2 years) |
| Patchy rural 5G coverage for connected machinery | -0.8% | Rural areas nationwide, especially Great Plains and Mountain West | Long term (≥ 4 years) |
| Volatile commodity-price swings curbing farm capital expenditure | -1.2% | National, with heightened impact in Midwest corn belt | Medium term (2-4 years) |
| Lengthy Environmental Protection Agency Tier 5 Emission compliance lead-times | -0.6% | OEM manufacturing hubs | Medium term (2-4 years) |
| Source: Mordor Intelligence | |||
Dealer Technician Shortage
The equipment service industry faces a significant labor shortage. The consolidation of service locations has reduced the number of physical stores, increasing response times during critical planting and harvest periods. Modern precision equipment requires specialized diagnostic capabilities that exceed the skills available in rural labor markets, compelling Original Equipment Manufacturers (OEMs) to expand remote support services and implement modular component replacement systems. These labor constraints have led farmers to restrict their purchases of agricultural machinery.
Lengthy Environmental Protection Agency Tier 5 Emission Compliance Lead-Times
The implementation of stricter nitrogen oxide and particulate emission limits in 2028 requires original equipment manufacturers (OEMs) to redesign engine platforms, modify production facilities, and align supplier capabilities[2]Environmental Protection Agency, “Proposed Tier 5 Standards,” epa.gov. The extended vehicle certification processes can affect product launch schedules and increase dealer inventories of pre-regulation models. The capital required for regulatory compliance may reduce investments in digital technologies unless manufacturers receive policy incentives or carbon credits to offset these costs.
*Our forecasts treat driver/restraint impacts as directional, not additive. The impact forecasts reflect baseline growth, mix effects, and variable interactions.
Segment Analysis
By Product Type: Dominance of Tractors Amid Rapid Irrigation Gains
Tractors maintain a 50.62% share of the United States agricultural machinery market in 2025, demonstrating their essential role in tillage, seeding, and material handling. The segment's revenue growth stems from high-horsepower models, while compact tractors increasingly incorporate electric drivetrains for specialty farming applications. Irrigation equipment, though a smaller segment, is projected to achieve the highest growth rate at 9.26% CAGR through 2031. Modern irrigation systems, including center pivots, drip lines, and sensor-controlled valves, integrate real-time soil moisture data, reducing water consumption by up to 25%. This growth aligns with Western state groundwater regulations and federal WaterSMART program incentives.
In plowing and cultivating systems, manufacturers incorporate variable-depth tillage technology to reduce soil disruption, maintaining steady growth despite increasing no-till farming practices. Advanced seeding and planting equipment enable precise single-kernel placement, improving emergence rates and supporting precise nutrient application. While harvesting machinery demand correlates with row-crop prices, new combines featuring predictive ground-speed automation improve fuel efficiency and throughput, driving replacement demand. Farmers increasingly opt to upgrade existing equipment with autonomous guidance and variable-rate controllers instead of purchasing new machinery, resulting in parts and digital service revenue exceeding equipment sales. Across equipment categories, sensor systems and ISOBUS-compatible controllers establish brand-independent ecosystems, reducing manufacturer lock-in and requiring traditional manufacturers to provide open APIs to maintain tractor market position.


By Farm Size: Mid-Scale Operations Anchor Demand but Small Farms Accelerate
Operations spanning 500-2,000 acres represented 42.48% of the United States agricultural machinery market size in 2025, balancing economies of scale with owner-operator flexibility. These farms primarily invest in mid-range horsepower tractors and specialty attachments, offsetting price increases through yield benefits and input savings. Farms under 500 acres are experiencing an 7.96% CAGR, driven by high-value produce, direct-to-consumer channels, and controlled-environment facilities. These operators utilize electrified compact tractors and subscription models to reduce capital requirements. The United States Department of Agriculture research indicates 70% of large farms use autosteering systems compared to 38% for small producers, with this gap narrowing due to decreasing costs and grant support.
Farms exceeding 2,000 acres continue to adopt fully autonomous fleets to optimize labor scheduling and nighttime operations. Their procurement strategies emphasize multi-year contracts with OEM rental fleets, typically including agronomy analytics services. While technology adoption remains strong, declining net farm income, projected to decrease 25% in 2024, results in selective postponement of non-essential upgrades. This market segmentation has led OEMs to expand their financial solutions, incorporating pay-per-use and revenue-share programs designed for varying cash flows across different farm sizes.
Geography Analysis
Regional variations characterize procurement patterns across the United States agricultural machinery market. The Midwest maintains the largest market share due to extensive corn and soybean acreage requiring high-horsepower tractors, self-propelled sprayers, and large combines. Chapter 12 bankruptcies increased 69% in Midwestern districts during the same year, causing some operators to delay equipment replacement while investing selectively in variable-rate technology for efficiency improvements.
The West Coast represents the fastest-growing sub-regional market, influenced by specialty crop automation requirements and environmental regulations favoring electric equipment. California incentive programs and NRCS cost shares reduce battery tractor payback periods to under four years, while venture capital supports domain-specific robotics development. Satellite backhaul connectivity improvements address topographical challenges in coastal ranges, increasing telematics adoption.
The Southeast shows varying market conditions, with hurricanes and irregular rainfall patterns increasing demand for sensor-controlled irrigation systems, while smaller family farms face ongoing capital limitations. The Northeast's concentration of greenhouse and nursery operations sustains demand for compact, maneuverable equipment with advanced climate-control systems. The Infrastructure Investment and Jobs Act enables cross-regional infrastructure development, creating opportunities for OEM construction subsidiaries to provide road and drainage equipment that supports farm logistics, complementing their agricultural equipment lines.
Regulatory Landscape
Agricultural machinery in the United States is shaped by safety, on-road operation, and emissions rules that affect both equipment design and aftermarket practices. Worker safety requirements are codified under OSHA in 29 CFR Part 1928, including rollover protective structures (ROPS) provisions for tractors (OSHA 1928.51). For equipment operating on public roads, lighting and marking requirements referenced in 49 CFR Part 562 (including incorporated ANSI/ASAE standards) drive OEM and dealer compliance work, especially for towed implements and wider machines used in mixed farm-to-market operations.
On the powertrain side, EPA oversight of nonroad compression-ignition engines remains a key compliance anchor for diesel equipment platforms, with OEMs managing certification lead times and redesign cycles. In July 2026, EPA proposed amendments affecting how newly manufactured nonroad equipment handles diesel exhaust fluid (DEF) system-related derates, along with a proposal to allow certain nonconformance penalties beginning with model year 2027 heavy-duty diesel engines, indicating continued regulatory attention to emissions-system operation and manufacturer compliance pathways. On incentives and enabling policy, FY2026 agriculture appropriations (P.L. 119-37, enacted November 12, 2025) and 2026 farm-bill proposals such as H.R. 7567 (which proposes higher cost-share levels for precision agriculture practices) reinforce the linkage between conservation programs and adoption of precision and connected equipment.
Competitive Landscape
The United States agricultural machinery market is highly concentrated, with five companies - Deere & Company, CNH Industrial NV, AGCO Corporation, Kubota Corporation, and Mahindra & Mahindra Ltd.- dominating the United States agricultural machinery market in 2024. Competition now centers on connected software ecosystems, autonomous capabilities, and sustainability features rather than mechanical performance. AGCO's USD 2 billion acquisition of Trimble's agriculture business created PTx Trimble, enhancing guidance and data-sharing capabilities across multiple equipment brands. Deere has allocated USD 20 billion for United States manufacturing upgrades and digital services over the next decade to improve product development cycles and strengthen domestic supply chains.
Startups such as Bonsai Robotics and Agtonomy focus on specialty crop segments where established manufacturers have limited presence. Traditional equipment manufacturers are forming partnerships with technology companies. New Holland's collaboration with Bluewhite implements autonomous retrofits for orchards, potentially reducing operating costs by 85% for specialty crop growers. In response, Deere has introduced open-API initiatives while CNH pursues acquisitions focused on software and electrification.
The top ten multistore dealer groups operated 2,656 outlets in 2024, improving inventory management and service delivery. While consolidated dealers gain increased negotiating power with manufacturers, they also enable standardized digital support systems that facilitate nationwide technology adoption. The market share of the three largest manufacturers is anticipated to remain stable in the near term, though new competitors may challenge specific product categories, particularly in electric compact equipment.
United States Agricultural Machinery Industry Leaders
Deere & Company
CNH Industrial NV
AGCO Corporation
Kubota Corporation
Mahindra & Mahindra Ltd.
- *Disclaimer: Major Players sorted in no particular order

Market Opportunities and Future Outlook
Federal programs and test infrastructure are widening the route from pilots to adoption of digital, AI-enabled, and automation features in farm operations. In April 2026, USDA launched the National Proving Grounds Network for AgTech (NPG-Ag) to test digital and AI-driven tools under real-world US conditions, supporting OEMs, retrofit-kit providers, and software players that want standardized validation and lower adoption risk for telematics, decision support, and autonomous-ready systems. Alongside this, USDA specialty crop support announced in April 2026 included over USD 275 million in FY2026 funding, with a USD 20 million set-aside within the Specialty Crop Research Initiative (SCRI) for mechanization and automation R&D, pointing to near-term funding for labor-saving equipment in high-value crops.
Serviceability is also becoming a differentiator alongside core machine performance. Deere's January 2026 groundbreaking for a new parts distribution center in Hebron, Indiana highlights how parts availability and uptime can matter more as connected fleets generate more service events and software-dependent diagnostics. USDA and ARS funding activity, including the FY26 AI Innovation Fund that supports multiple small AI/ML projects, also creates entry points for startups and suppliers building targeted algorithms, sensor fusion, and maintenance analytics that can be packaged into retrofit offerings and dealer-installed upgrades, aligning with the installed base's push to extend replacement cycles in cost-conscious purchasing periods.
Recent Industry Developments
- July 2026: Deere & Company entered an agreement with the US Federal Trade Commission and five states to provide farmers and independent technicians access to diagnostic and repair tools for current and future equipment. The agreement formalizes access practices that affect uptime, repair lead times, and total cost of ownership across connected fleets. It also increases compliance discipline around software-enabled service functions, shaping how OEMs, dealers, and third-party repair networks support precision and autonomous-ready machines.
- June 2026: CNH Industrial inaugurated a EUR 21 million virtual simulation ecosystem and an automated AutoStore logistics warehouse at its San Matteo R&D hub in Modena, Italy. The upgrade is aimed at faster product development cycles and higher parts availability, and the company cited 24-hour parts availability support for more than 1,200 dealers. For US agriculture equipment owners, the investment emphasizes parts logistics and engineering throughput as levers for sustaining connected-machine uptime and rollout cadence for new precision features.
- June 2024: CNH Industrial partnered with Bluewhite to integrate autonomous systems into New Holland tractors, extending autonomy from specialty retrofits into OEM-aligned offerings. The collaboration targets orchard and specialty-crop use cases where labor availability and consistency are key purchase drivers. It also raises competitive pressure for other OEMs and retrofit providers to deliver interoperable autonomy and guidance packages across mixed fleets.


Research Methodology Framework and Report Scope
Market Definition and Coverage
For this report, the market is defined as the value of agricultural machinery sold for use in farming operations within the United States, covering major equipment categories used for field preparation, planting, harvesting, irrigation, and forage work.
Scope exclusions: Used equipment resale values, repair and maintenance services, and standalone spare parts are not counted unless bundled into a new machinery sale.
Segmentation Overview
- By Product Type
- Tractors
- Plowing and Cultivating Machinery
- Plows
- Harrows
- Cultivators and Tillers
- Other Plowing and Cultivating Machinery
- Planting Machinery
- Seed Drills
- Planters
- Spreaders
- Other Planting Machinery
- Harvesting Machinery
- Combine Harvesters
- Forage Harvesters
- Other Harvesting Machinery
- Haying and Forage Machinery
- Mowers
- Balers
- Other Haying and Forage Machinery
- Irrigation Machinery
- Sprinkler Irrigation
- Drip Irrigation
- Other Irrigation Machinery
- Other Agricultural Machinery
- By Farm Size
- Less Than 500 acres
- 500-2,000 acres
- More Than 2,000 acres
Data Validation & Update Cycle
Validation is done through several passes that compare model outputs against independent signals, including farm income direction, trade and production indicators, and observed price movement for machinery. If a category shows an unusual jump, we re-check the math, revisit the driver assumptions, and then re-contact selected interviewees to confirm whether it is a real market change or an input issue.
Before sign-off, the dataset and calculations are reviewed by another analyst so definitions, units, and currency timing are consistently applied across years. Reports are refreshed annually, and interim updates are made when material events can shift demand or pricing. Right before delivery, a final review pass is completed so clients receive the most current view available at that time.
Mordor Intelligence's United States Agricultural Machinery Market Size Compared Against Other Published Estimates
It is normal to see different published market sizes for US agricultural machinery, even when the topic sounds identical at first glance. The gaps usually come from how each publisher defines what counts as machinery versus adjacent spend, what year is treated as the base, and how price changes are carried through the forecast.
Some external estimates appear to roll in a broader agriculture equipment wallet that can include items like used equipment value, aftermarket parts, or wider technology add-ons depending on their definition. In Mordor Intelligence, the number is kept tied to new machinery sales value across the defined equipment groups, and then it is checked against acreage, replacement behavior, and price indices so the scope stays consistent year to year.
Benchmark comparison
| Source | Market Size | Gaps in Research Methodology |
|---|---|---|
| Mordor Intelligence | USD 30.20 B (2025) | |
| Industry Publisher A | USD 42.05 B (2025) | The figure is likely built on a wider equipment basket or a different revenue capture method that can pull in additional spend categories beyond new machinery sales, which lifts the headline value for the same year. |
| Research Firm B | USD 39.40 B (2024) | The estimate uses a different base year and a broader segmentation lens, and it may also include additional equipment groupings or distribution channel assumptions that are not matched one-for-one to the machinery-only scope. |
Looking across the table, the spread is mostly explained by scope and base-year choices, followed by how price progression is treated across categories. By keeping the inputs traceable to farm demand indicators and by re-checking assumptions with industry respondents, the resulting market size stays easier to reproduce and compare over time.


Key Questions Answered in the Report
What is the current value of the United States agricultural machinery market?
The United States agricultural machinery market size is valued at USD 32.14 billion in 2026 and is projected to rise to USD 43.84 billion by 2031.
Which product category is growing the fastest in United States farm equipment?
Irrigation machinery is projected to post the highest growth, expanding at a 9.26% CAGR through 2031.
How much revenue do tractors contribute to equipment sales?
Tractors accounted for 50.62% of total equipment revenue in 2025 and continue to hold the largest share among all product types.
What is the typical acreage range for farms that buy the most machinery?
Operations between 500 and 2,000 acres captured 42.48% of 2025 sales because they balance scale efficiencies with owner-operator flexibility.
Page last updated on:




