
Talc Market Size and Share
Market Overview
| Study Period | 2021 - 2031 |
|---|---|
| Market Volume (2026) | 8.80 Million tons |
| Market Volume (2031) | 10.87 Million tons |
| Growth Rate (2026 - 2031) | 4.31% CAGR |
| Fastest Growing Market | Asia-Pacific |
| Largest Market | Asia-Pacific |
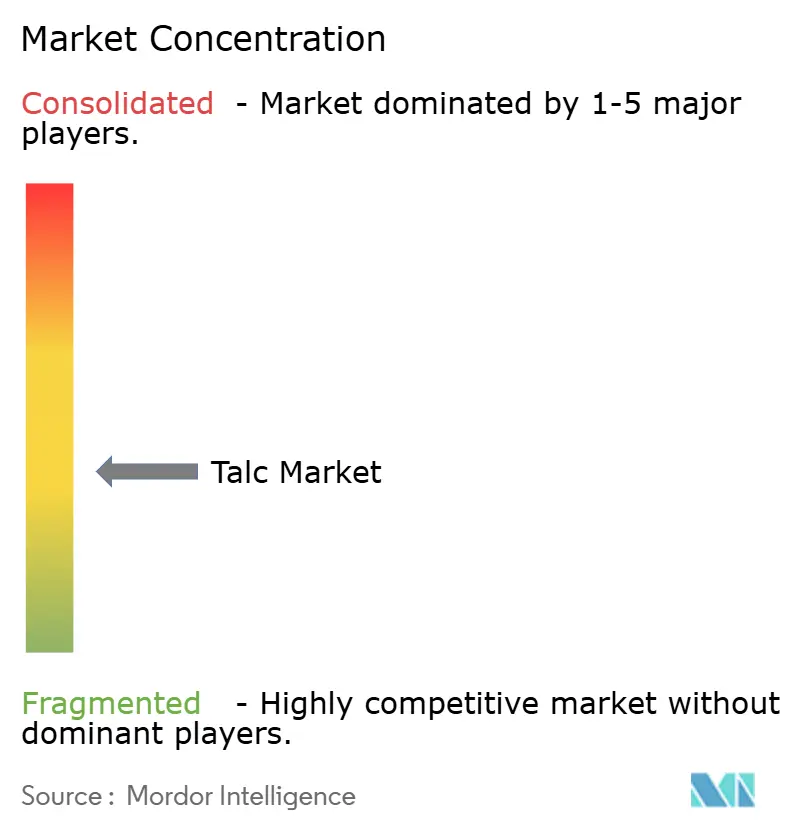
| Market Concentration | Medium |
Major Players *Disclaimer: Major Players sorted in no particular order Image © Mordor Intelligence. Reuse requires attribution under CC BY 4.0. | |
Talc Market Analysis by Mordor Intelligence
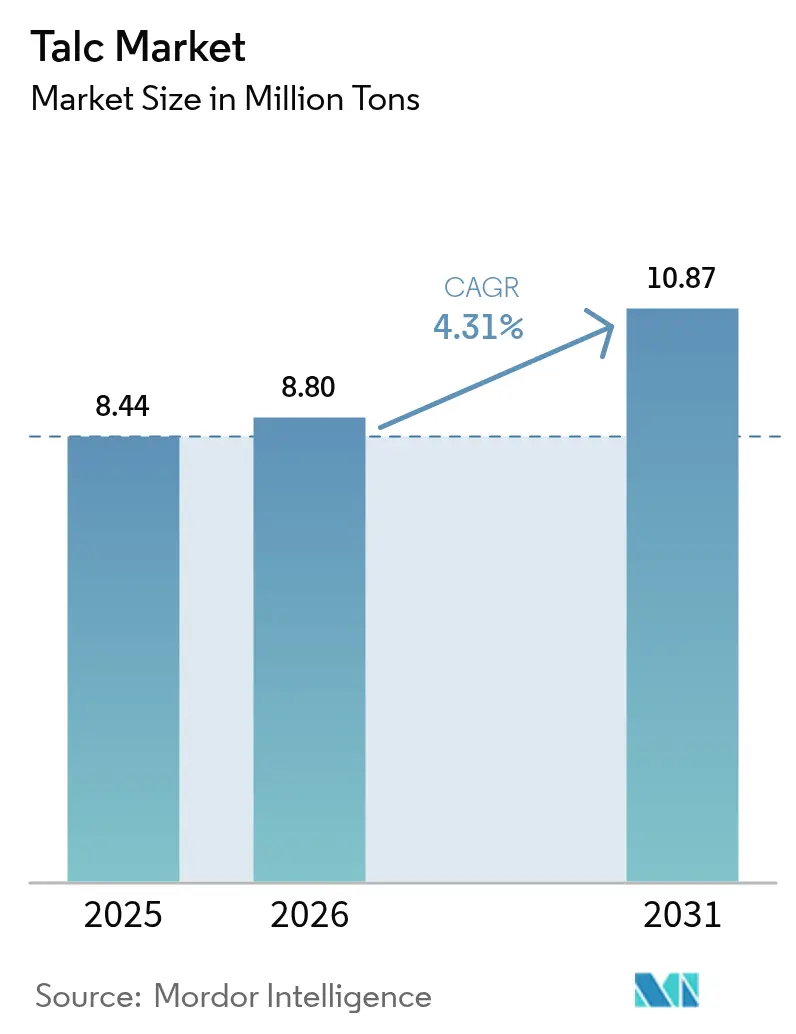
The Talc Market size is expected to grow from 8.44 Million tons in 2025 to 8.80 Million tons in 2026 and is forecast to reach 10.87 Million tons by 2031 at 4.31% CAGR over 2026-2031. Rising demand in Asia-Pacific, coupled with application-specific grade optimization, is reshaping trade flows and tightening quality specifications. Ceramics producers in India and Vietnam are adding multi-million-square-meter tile lines, lifting regional offtake, while Chinese automakers mandate lightweight polypropylene (PP) and thermoplastic olefin (TPO) components that embed 15%–25% talc by weight to meet fuel-economy targets. At the same time, China’s GB30981.1-2025 standard for water-based architectural paints, effective June 2026, raises talc loading levels by 30%–40% to maintain opacity and scrub resistance. Persistent North American litigation, the exit of Minerals Technologies, and labor disruptions at Nordic mines temper supply resilience but accelerate investment in AI-enabled ore-sorting to boost recovery rates and lower unit costs.
Key Report Takeaways
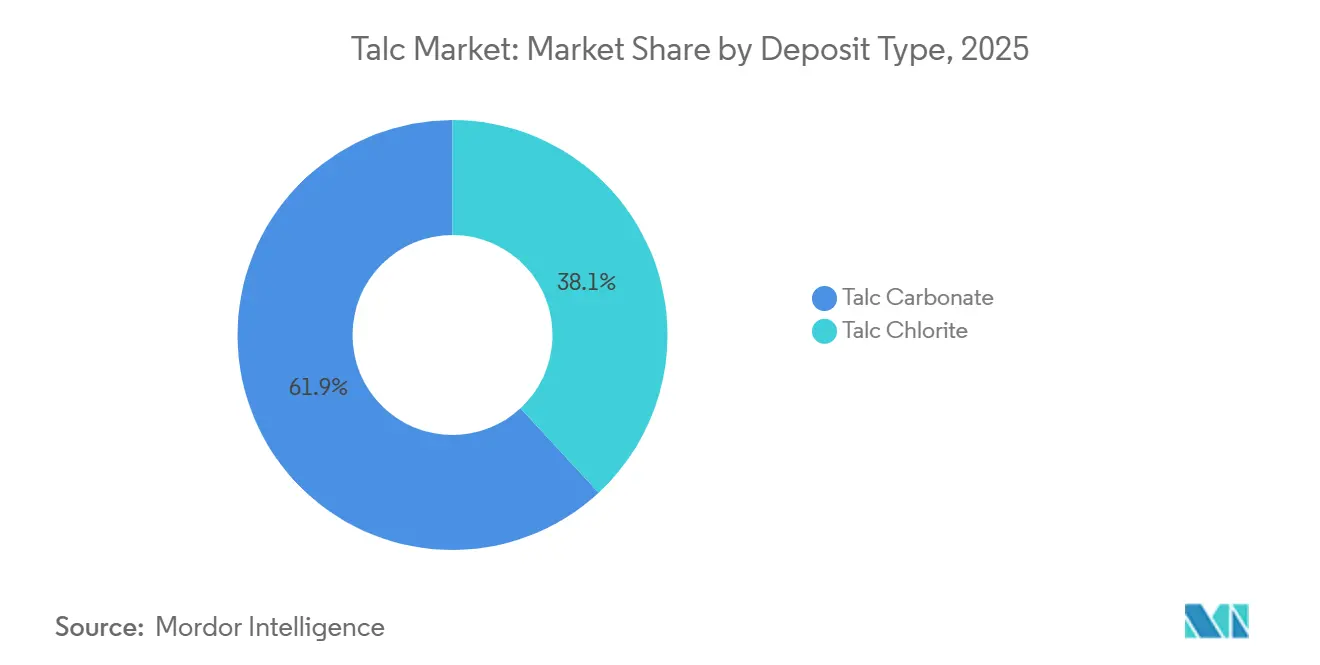
- By deposit type, talc carbonate led with 61.90% of 2025 volume; talc chlorite is forecast to grow at a 4.76% CAGR through 2031.
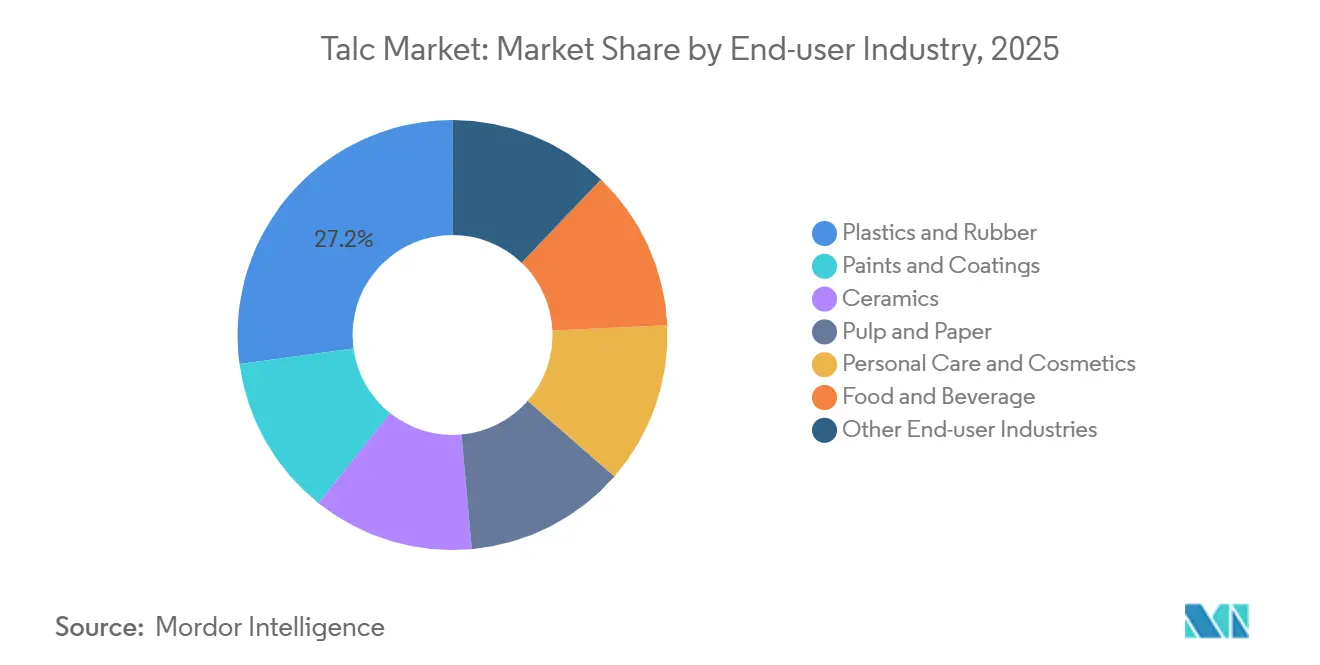
- By end-user industry, plastics and rubber captured 27.15% of 2025 demand and is projected to expand at a 4.98% CAGR over 2026–2031.
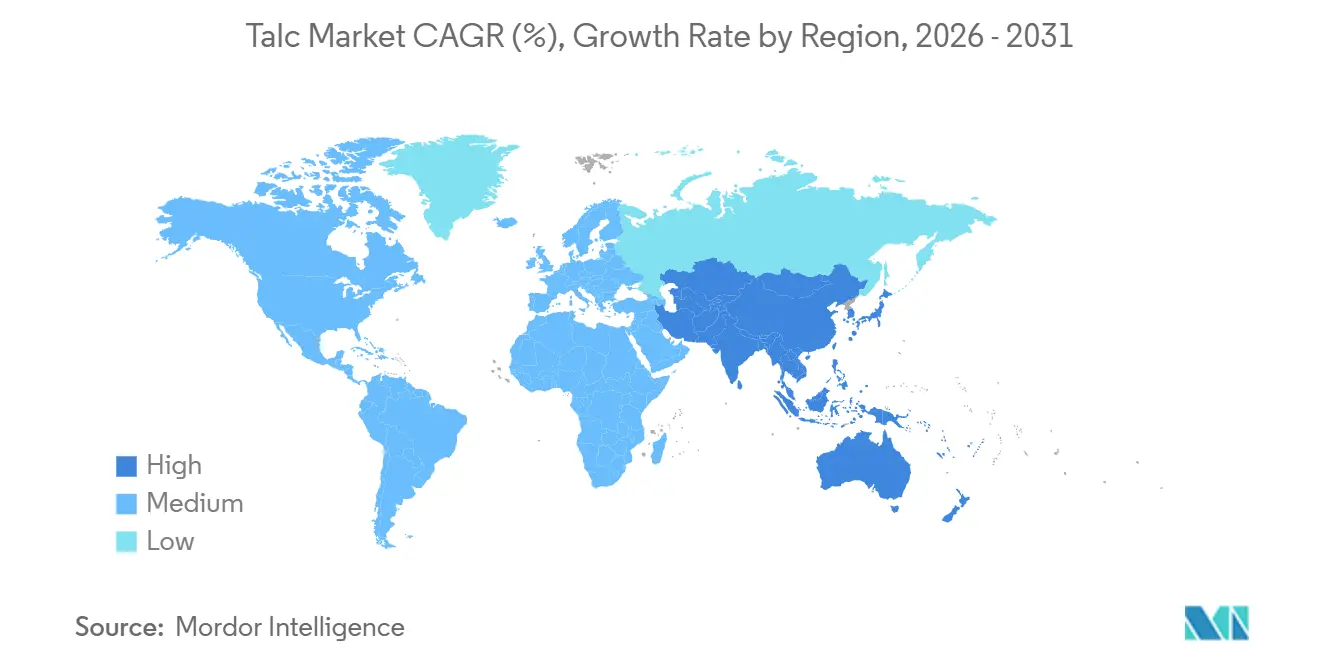
- By geography, Asia-Pacific commanded 53.22% of 2025 consumption and is set to grow at a 5.18% CAGR to 2031.
Note: Market size and forecast figures in this report are generated using Mordor Intelligence’s proprietary estimation framework, updated with the latest available data and insights as of 2026.
Global Talc Market Trends and Insights
Drivers Impact Analysis*
| Driver | (~) % Impact on CAGR Forecast | Geographic Relevance | Impact Timeline |
|---|---|---|---|
| Robust PP and TPO Adoption in Automotive Lightweighting | +1.2% | Global, with concentration in China, ASEAN, North America | Medium term (2-4 years) |
| Growing Shift to Water-Based Architectural Paints in Asia | +0.9% | Asia-Pacific core, particularly China, India, Vietnam | Short term (≤ 2 years) |
| Strong Demand for Talc-Filled Polymer Masterbatch in Packaging | +1.1% | Global, with early gains in ASEAN, South Asia, Europe | Medium term (2-4 years) |
| Expansion of Ceramics Production in South and Southeast Asia | +0.8% | India, Vietnam, Thailand, Indonesia | Long term (≥ 4 years) |
| AI-Enabled Ore-Sorting Boosting Ore Recovery and Unit Economics | +0.3% | Global mining regions, early adoption in Australia, Canada, China | Long term (≥ 4 years) |
| Source: Mordor Intelligence | |||


Robust PP and TPO Adoption in Automotive Lightweighting
Automakers embed 15%–25% talc in PP and TPO compounds to achieve stiffness-to-weight ratios that meet fuel-economy and EV-range mandates without retooling injection lines. Imerys opened a EUR 43 million facility in Wuhu in 2025 to supply 30,000 tons of ultra-fine grades targeted at battery housings and interior panels. The OECD projects plastics use in Southeast and East Asia to rise from 60 million tons in 2019 to 150 million tons by 2060, with automotive and electronics driving the steepest slopes. Malaysia’s circular-economy initiative recovered 12,000 tons of PP and ABS from end-of-life vehicles in 2024, a figure expected to triple by 2030. Talc’s nucleating effect shortens molding cycles by 8%–12%, raising throughput for tier-one suppliers operating at 85%–90% capacity utilization.
Growing Shift to Water-Based Architectural Paints in Asia
China’s GB30981.1-2025 caps VOCs at 80 g/L for interior coatings, forcing formulators to adopt aqueous binders that require higher talc loadings. India’s Bureau of Indian Standards is drafting similar limits for notification in late 2026. Water-based systems typically contain 12%–18% talc, up from 8%–12% in solvent-borne paints, because the mineral’s lamellar platelets compensate for lower hiding power. Thailand’s Office of Industrial Economics recorded a 17.27% rise in domestic talc output in 2024, with exports up 14.73% on demand from Vietnam, Indonesia, and the Philippines. Compared with titanium dioxide, talc is priced at USD 150–250 per ton, enabling paint makers to hold shelf prices steady despite inflation in other additives.
Strong Demand for Talc-Filled Polymer Masterbatch in Packaging
Flexible-packaging converters dose 3%–5% talc masterbatch into polyethylene and polypropylene films to improve slip and anti-block properties at high line speeds. The OECD estimates packaging will account for 40% of incremental plastics volume in ASEAN through 2060, translating into 15,000–20,000 additional tons of talc demand per year. Talc’s platelet morphology reduces coefficient of friction from 0.5 to 0.3, cutting web breaks by half and justifying a USD 0.02–0.03 per kg premium for pre-compounded masterbatch. EU Ecolabel criteria now award points for mineral fillers that displace virgin polymer, indirectly favoring talc in retail and e-commerce packaging[1]European Commission, “EU Ecolabel Criteria for Plastic Carriers,” ec.europa.eu . Masterbatch suppliers are co-locating plants within 50 km of major film extruders to tighten logistics and raise switching costs.
Expansion of Ceramics Production in South and Southeast Asia
India’s ceramic-tile revenue reached INR 51,000–53,000 crore (USD 6.1–6.4 billion) in FY 2025 on 6%–7% domestic volume growth. Kajaria, Somany, and Asian Granito announced 25.4 million m² of new capacity, requiring 45,000–50,000 tons of talc annually. Vietnam’s tile exports to the United States and EU climbed 22% in 2024, prompting investment in roller kilns that shorten firing times from 50 minutes to 35 minutes, demanding tighter talc particle distributions. Thailand and Indonesia are each adding 8–10 million m² of glazed porcelain lines to exploit anti-dumping gaps in Middle Eastern and African markets. Talc lowers firing temperature by 30–50 °C, delivering natural-gas savings of 10%–12% when energy exceeds USD 8 per MMBtu.
Restraints Impact Analysis*
| Restraint | (~) % Impact on CAGR Forecast | Geographic Relevance | Impact Timeline |
|---|---|---|---|
| Persistent Asbestos-Related Litigation Costs | -0.6% | North America, Europe, with spillover to Australia | Long term (≥ 4 years) |
| Bio-Based Fillers Replacing Talc in Premium Papers | -0.4% | Europe, North America | Medium term (2-4 years) |
| High-Purity Ore Shortages in Europe After Finnish Labor Strike | -0.3% | Europe, with secondary impact on North America and Asia pharmaceutical/food-grade buyers | Short term (≤ 2 years) |
| Source: Mordor Intelligence | |||
Persistent Asbestos-Related Litigation Costs
Johnson & Johnson offered USD 10 billion in May 2024 to settle 62,000 ovarian-cancer claims tied to cosmetic talc. The proposal remains in limbo after successive Chapter 11 filings by LTL Management were dismissed, prolonging uncertainty for upstream miners. Minerals Technologies booked a USD 215 million provision in Q1 2025 to fund a trust for 684 open cases, after divesting Barretts Minerals for USD 32 million. Imerys obtained 90% creditor approval in January 2025 for its North American restructuring, ring-fencing legacy liabilities but constraining balance-sheet flexibility. Insurance premiums on talc producers’ primary layers rose 40%–60% in 2025, while aggregate limits tightened to USD 50–100 million, compelling mid-tier players to self-insure or exit cosmetic grades.
Bio-Based Fillers Replacing Talc in Premium Papers
European and North American mills are shifting to precipitated calcium carbonate, kaolin, and cellulose nanofibers to satisfy brand-owner sustainability mandates. Talc’s share in European paper applications fell from 12% in 2020 to below 9% in 2025. Alternatives cost 5%–10% more yet qualify for carbon-capture credits under the EU Emissions Trading System, closing the economic gap. Micro-fibrillated cellulose trials at 2%–4% loadings deliver 15%–20% tensile-strength gains, enabling basis-weight down-gauging that offsets higher raw-material costs. The European Commission’s proposed Ecodesign for Sustainable Products Regulation, slated for 2028, will require material passports—a transparency obligation that disadvantages feedstocks with opaque mining footprints. U.S. specialty paper producers echo the shift as luxury-goods brands commit to plastic-free packaging.
*Our forecasts treat driver/restraint impacts as directional, not additive. The impact forecasts reflect baseline growth, mix effects, and variable interactions.
Segment Analysis
By Deposit Type: Chlorite Grades Gain in Specialty Applications
Talc carbonate accounted for 61.90% of 2025 tonnage, thanks to abundant metamorphic belts in China, India, and Brazil that yield cost-effective ore for plastics, paints, and ceramics. Talc Chlorite, holding the balance, will expand at a 4.76% CAGR as automotive and electronics customers impose sub-50 ppm iron limits impossible for many carbonate ores. Chlorite talc delivers less than 0.05% iron versus 0.15%–0.30% for carbonate, eliminating color shift in white automotive trim and cutting bleaching costs in cosmetic formulations. Chlorite grades fetch a USD 50–100 premium but reduce kiln CO₂ evolution by 8%–12%, aiding EU carbon-pricing compliance. Finnish labor strikes in 2024 sidelined 40,000–50,000 t/y, forcing buyers to pre-book 60%–70% of annual needs under fixed-price contracts, a structural move that reshapes the talc market share at the value-added end of the spectrum.
Stockpiling by Japanese and South Korean electronics firms illustrates tightness: importers doubled safety inventories to 45 days in 2025, up from 22 days pre-strike, insulating supply chains yet locking in working capital. Indian processors eye Western Australia’s chlorite veins to diversify sourcing and hedge currency exposure. Carbonate ore remains indispensable for construction fillers and rubber, where price outweighs purity.

By End-user Industry: Plastics and Rubber Lead Growth Amid Lightweighting Push
Plastics and rubber consumed 27.15% of global tonnage in 2025, and this slice will widen as the segment logs a 4.98% CAGR through 2031. PP compounds with 20%–30% talc achieve flexural modulus above 2,500 MPa, letting automakers thin wall sections by 15%–20% and cut vehicle weight by 4–5 kg per car. Imerys’s Wuhu plant targets ultra-fine talc for electric-vehicle battery housings, priced at USD 400–500 per ton, underpinning a high-margin niche.
Paints and coatings are benefiting from Asia’s pivot to low-VOC water-borne systems. Ceramics demand is driven by India’s affordable-housing boom and Vietnam’s export surge. Pulp and paper, personal care and cosmetics, and food and beverage face substitution from bio-based fillers and heightened safety oversight. The FDA’s 2024 guidance that each cosmetic-talc batch undergoes microscopy testing inflates per-batch costs by USD 5,000–10,000. Ancillary segments such as roofing membranes and sealants mirror construction cycles in emerging economies, offering mid-single-digit growth.

Geography Analysis
Asia-Pacific’s 53.22% slice in 2025 and a 5.18% forecast CAGR rely on synchronized forces. India’s ceramic sector generated INR 51,000–53,000 crore (USD 6.1–6.4 billion) in FY 2025, underpinned by 6%–7% domestic tile demand and 25.4 million m² of announced capacity. Vietnam’s tile exports jumped 22% in 2024 after anti-dumping rulings against Chinese products, spurring investment in roller-kiln retrofits that demand finer talc to avert warping. China’s GB30981.1-2025 VOC cap forces formulators to raise talc in water-based paints by 30%–40%. Thailand’s 17.27% rise in 2024 output reflects its role as an ASEAN processing hub. OECD long-range models see regional plastics demand tripling to 150 million tons by 2060, locking talc into the lightweighting narrative. Japan and South Korea specialize in chlorite-grade imports for electronics and pharma, where sub-ppm heavy-metal limits create high barriers to entry.
North America’s growth is restricted owing to litigation and producer exits. Minerals Technologies’ April 2024 sale of Barretts Minerals for USD 32 million underscores the squeeze between liability risk and operating returns. Johnson & Johnson’s unresolved USD 10 billion proposal magnifies insurance costs, adding 40%–60% to premiums. U.S. mines in Montana and Vermont still supply automotive and paints customers, but new permits evolve slowly amid public scrutiny. In Canada and Mexico, primarily in auto plastics, covered by USMCA rules favouring local content. The FDA’s 2024 microscopy mandate raises batch-testing costs, nudging niche cosmetics brands toward starch alternatives[2]U.S. FDA, “Testing of Talc-Containing Cosmetic Products,” fda.gov .
Europe is curbed by bio-based substitution in premium paper and the March 2025 bankruptcy of Imerys Talc Italy. Nordic chlorite operations feed pharmaceutical and food-contact markets, strike, tighten spot supply, and drive buyers to commit 60%–70% of annual needs under take-or-pay terms. Germany, France, the UK, and Italy’s consumption spans automotive, architectural paints, and ceramics. The EU’s forthcoming Ecodesign Regulation, which will require material passports from 2028, favors fillers with transparent provenance and lower life-cycle carbon, putting cost pressure on energy-intensive talc producers. South America and the Middle-East and Africa together take a smaller share, led by Brazil’s auto plastics and Saudi Arabia’s nascent ceramics clusters, though currency swings and logistics bottlenecks limit velocity.

Value Chain Analysis
The talc value chain begins with exploration and mining of talc carbonate and talc chlorite ores, followed by beneficiation steps such as crushing, flotation or magnetic separation where needed, and drying. The material is then milled and classified into controlled particle-size distributions to match end-use requirements across plastics and rubber, paints and coatings, ceramics, and regulated grades for personal care, food contact, and pharmaceuticals.
Product differentiation is typically formed at processing through purity (low iron and heavy metals), traceability, and contamination control, supported by third-party lab testing and in-line particle-size monitoring used to meet tighter automotive and electronics specifications. Downstream flows mostly through bulk and bagged shipments to compounders and masterbatch producers, paint formulators, and ceramic body manufacturers, with logistics costs and import dependence shaping competitiveness in deficit regions. The evidence pack cites US crude talc production of about 490,000 metric tons in 2025 from five mines, alongside roughly 260,000 metric tons of imports in 2025 (about 12% higher than 2024), which points to a two-track supply structure of domestic industrial output and traded material. Key bottlenecks include access to high-purity chlorite-grade supply after disruptions (including Nordic labor actions referenced in the report context), evolving buyer testing requirements for asbestos risk management, and energy and freight costs that affect delivered economics into compounding and coatings hubs.
Competitive Landscape
The talc market is moderately concentrated. The five largest players—Imerys, Golcha Group, Sibelco, Magris Performance Materials, Minerals Technologies Inc. and IMI Fabi SpA controlled 40%–45% of global capacity, while hundreds of regional miners in China, India, and Brazil fragment the rest. Golcha Group leverages 24 million tons of reserves in Rajasthan, extracting 300,000 tons of crude and processing 200,000 tons of finished talc annually, capturing USD 20–30 per ton in freight savings inside a 500 km radius. Imerys pivoted toward specialty automotive and electronics grades, commissioning its Wuhu plant in 2025, expected to deliver EUR 30 million in annual sales when fully ramped. Sibelco and Nippon Talc employ in-line particle-size analyzers that cut batch variation below 2%, meeting tier-one automotive tolerances beyond the reach of smaller Asian competitors.
Riverspan Partners, a private-equity entrant, bought Barretts Minerals for USD 32 million with plans to pivot away from cosmetic grades to industrial fillers, sidestepping litigation drag. Technology adoption is uneven: Australian and Canadian mines integrate AI-enabled ore sorting, shaving energy use by 10%–12%, whereas many Chinese pits still hand-pick ore, widening cost spreads. The FDA’s 2024 microscopy rule raises the bar for ISO 17025 labs, indirectly consolidating supply among vertically integrated processors. Meanwhile, insurers have narrowed aggregate coverage, prompting self-insurance or cosmetic-grade withdrawal among mid-tier firms. Against this backdrop, specialty chlorite suppliers enjoy pricing power, while carbonate producers fight commoditization through logistics optimization and service bundling.
Talc Industry Leaders
Imerys
Magris Performance Materials
Golcha Group
Minerals Technologies Inc.
IMI Fabi SpA
- *Disclaimer: Major Players sorted in no particular order

Market Opportunities and Future Outlook
Near-term whitespace centers on supply-chain restructuring toward traceable, higher-purity talc and on regionalizing processing near fast-growing consuming clusters in Asia-Pacific plastics, coatings, and ceramics. In the report context, China’s GB30981.1-2025 water-based interior coatings standard, effective June 2026, formalizes higher talc loadings in paint formulations and raises the need for consistent lamellar grades. Automotive lightweighting also continues to favor suppliers that can maintain tight particle-size distribution and low-iron limits for PP and TPO compounds. Together, these demand-side changes create openings for processors that can certify low-contaminant material and support application qualification for compounders, paint makers, and tile producers.
Consolidation and asset repositioning are also changing how capacity is deployed, creating room for new industrial platforms. In the evidence pack, Vanderbilt Minerals filed Chapter 11 in February 2026 with asbestos-related liabilities, and High Divide Minerals acquired Vanderbilt in June 2026, combining multiple facilities into a larger industrial-minerals footprint. These moves point to an opportunity for acquirers to refocus portfolios toward industrial grades and contracts structured around customer specifications. In Europe, Tulikivi’s April 2026 public notice for environmental and water management permits for the Suomussalmi talc project highlights investment in traceable domestic supply for regulated applications, while USGS-noted US reliance on imports (about 260,000 metric tons in 2025) suggests continuing demand for qualified suppliers that can meet buyer QA requirements and stabilize deliveries into North America amid litigation-driven volatility.
Recent Industry Developments
- June 2026: High Divide Minerals acquired Vanderbilt Minerals, bringing multiple industrial-minerals facilities across Montana, Wyoming, and Connecticut under one platform that includes talc and wollastonite. The combination advances consolidation around industrial-grade supply and reshapes customer coverage by aggregating production, processing, and distribution capabilities under a single owner.
- April 2026: Tulikivi Corporation announced public notice for its environmental and water management permit application for the Suomussalmi talc project at its existing soapstone quarry site in Finland. The permitting step moves the project forward toward additional traceable talc supply in Europe, aligning with tighter provenance and quality requirements in regulated and specialty end uses.
- May 2024: Johnson & Johnson offered USD 10 billion to settle tens of thousands of ovarian-cancer claims tied to cosmetic talc, but the proposal remained unresolved as court proceedings continued. The ongoing uncertainty has reinforced risk aversion around cosmetic-grade talc and pushed parts of the supply chain toward industrial applications and more stringent testing and documentation practices.


Research Methodology Framework and Report Scope
Market Definition and Coverage
The talc market is defined as the supply and demand for talc as an industrial mineral, measured as volumes sold into end-use manufacturing and processing applications across major regions.
Scope exclusions: This sizing excludes downstream finished goods value (such as plastics parts, tiles, paper, paints, and personal care products) and counts only talc volumes.
Segmentation Overview
- By Deposit Type
- Talc Carbonate
- Talc Chlorite
- By End-user Industry
- Plastics and Rubber
- Paints and Coatings
- Ceramics
- Pulp and Paper
- Personal Care and Cosmetics
- Food and Beverage
- Other End-user Industries
- By Geography
- Asia-Pacific
- China
- India
- Japan
- South Korea
- ASEAN Countries
- Rest of Asia-Pacific
- North America
- United States
- Canada
- Mexico
- Europe
- Germany
- United Kingdom
- France
- Italy
- NORDIC Countries
- Rest of Europe
- South America
- Brazil
- Argentina
- Rest of South America
- Middle-East and Africa
- Saudi Arabia
- South Africa
- Rest of Middle-East and Africa
- Asia-Pacific
Data Validation & Update Cycle
Model outputs are triangulated against independent signals such as regional production indicators, trade flows, and application demand proxies, and then checked for unusual jumps that do not align with known capacity or demand events. Where variances are large, the supporting assumptions are reopened and respondents are re-contacted so the inputs can be clarified and corrected.
A multi-step analyst review is followed before sign-off, with consistency checks across regions, end uses, and implied per-unit consumption. Reports are refreshed annually, and interim updates are made when material events occur that can change supply, demand, or pricing direction. Before delivery, a fresh analyst pass is completed so clients receive the latest updated view.
Mordor Intelligence's Talc Market Estimate Compared With Other Published Estimates
It is normal to see different published market sizes for talc because the unit of measurement, the scope boundary, and the treatment of pricing can vary a lot between studies. Some sources report value in USD, while others track volume, and this alone can make two correct estimates look far apart.
The key gap drivers here are whether the estimate is built as tonnage sold into end uses versus revenue that can include trading margins and different grade mixes, and also how fast price-per-ton is assumed to move over time. Currency conversion timing, whether informal supply is counted, and how frequently assumptions are refreshed also affect the final number even when the end-use story is similar.
Benchmark comparison
| Source | Market Size | Gaps in Research Methodology |
|---|---|---|
| Mordor Intelligence | USD 8.44 M (2025) | |
| Industry Publisher A | USD 1.95 B (2024) | Reported in revenue terms and anchored to a value base year, which can layer in grade mix and pricing assumptions that are not comparable to a tonnage-led demand pool. |
| Industry Publisher B | USD 1.70 B (2024) | Uses a value-only framing with broad form and application coverage, and differences can come from how distributor margins and price progression are applied across regions. |
The table shows that the biggest spread is driven by unit choice and pricing treatment, not just demand direction. When the sizing is anchored to tons tied to end-use activity, and value is not forced through assumed price curves, the total stays traceable to real output indicators, which is the approach used by Mordor Intelligence.


Key Questions Answered in the Report
How large will the talc market be by 2031?
It is forecast to reach 10.87 million tons by 2031, advancing at a 4.31% CAGR from 2026 to 2031.
Which end-use segment will add the most incremental talc demand?
Plastics and rubber are projected to post the fastest 4.98% CAGR as automakers and packaging converters intensify lightweighting and performance requirements.
Why is Asia-Pacific the dominant consumption region?
Ceramics capacity additions, automotive lightweighting mandates, and new water-based paint regulations lift Asia-Pacific to 53.22% of global volume with a 5.18% CAGR through 2031.
How is litigation influencing North American supply?
Ongoing asbestos-related lawsuits have prompted producer exits, raised insurance premiums by 40%–60%, and capped regional growth at roughly 3% through 2031.
What advantages do chlorite-grade deposits offer?
Chlorite talc contains less than 0.05% iron, meets premium purity standards, lowers kiln CO₂ emissions by up to 12%, and therefore secures higher pricing in automotive, electronic, and cosmetic applications.
Page last updated on:






