
South America Peas Market Analysis by Mordor Intelligence
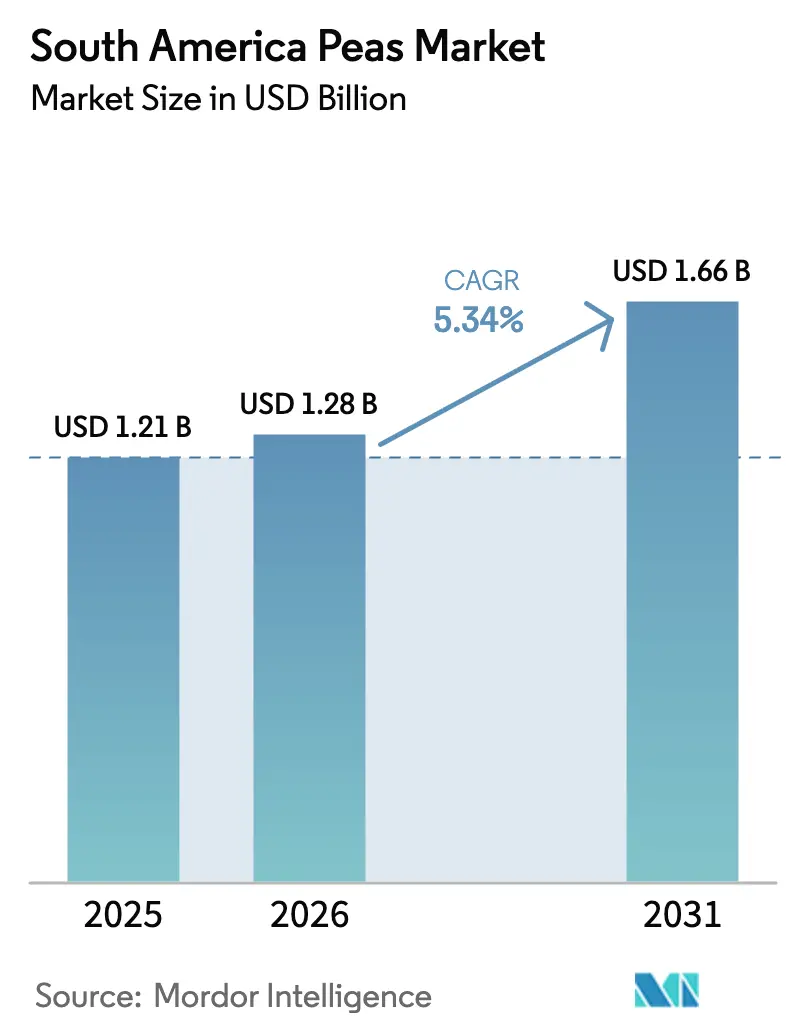
The South America Peas Market was valued at USD 1.21 billion in 2025 and projected to grow from USD 1.28 billion in 2026 to reach USD 1.66 billion by 2031, at a CAGR of 5.34% during the forecast period (2026-2031). Demand pivots on shifting global protein-isolate flows, stricter phytosanitary rules in Asia, and competitive logistics that channel more shipments from Argentina, Brazil, Peru, and Colombia toward import-dependent regions. Domestic investments in fractionation plants, cultivar innovation that widens planting windows, and government soil-health programs further reinforce acreage gains and processing capacity, while trader-led vertical integration compresses freight costs and supports export margins. At the same time, the expansion faces yield volatility in Andean highlands, storage gaps among smallholders, and price competition from high-margin soybean rotations. Still, the South America pea market shows resilient growth prospects as food, feed, and ingredient manufacturers seek traceable, non-genetically-modified protein inputs that can bypass tariff and antidumping hurdles in North America and Asia.
Key Report Takeaways
- By geography, Argentina led with 41.00% of the South America pea market share in 2025, while Brazil posted the highest projected CAGR at 8.30% through 2031.
Note: Market size and forecast figures in this report are generated using Mordor Intelligence’s proprietary estimation framework, updated with the latest available data and insights as of January 2026.
Market Trends and Insights
Drivers Impact Analysis of South America Peas Market*
| Driver | (~) % Impact on CAGR Forecast | Geographic Relevance | Impact Timeline |
|---|---|---|---|
| Rising vegan and plant-based diet adoption | +0.8% | Argentina, Brazil, urban Peru and Colombia | Medium term (2-4 years) |
| Export-driven demand from Europe and Asia | +1.2% | Argentina, Peru, and Colombia | Short term (≤ 2 years) |
| Improved high-yield pea cultivars | +0.6% | Argentina, Peru, and regional spill-over | Long term (≥ 4 years) |
| Government soil-health incentives for pulse rotation | +0.5% | Argentina, Colombia, and Peru | Medium term (2-4 years) |
| Local pea-protein isolate investments | +0.9% | Brazil, Argentina, and early-stage Peru | Medium term (2-4 years) |
| Trader-led vertical integration lowering logistics cost | +0.7% | Argentina, Brazil, and Peru | Short term (≤ 2 years) |
| Source: Mordor Intelligence | |||
Rising Vegan and Plant-Based Diet Adoption
Urban shoppers in Buenos Aires, São Paulo, Lima, and Bogotá are increasingly choosing flexitarian menus, creating shelf space for pea-based burgers, dairy alternatives, and ready-to-drink protein shakes. AGBM’s ≥75% protein concentrate delivers clean-label, non-genetically-modified claims that meet retailer standards. At the same time, R&S Blumos’ wet-extrusion line supplies 120-500 metric tons per month of textured ingredients for private-label plant meats [1]Source: AGBM, “AGBM | Productos,” agbm.com.ar. Embrapa (Empresa Brasileira de Pesquisa Agropecuária) Food Technology showed sensory parity between its domestic legume concentrates and imported pea isolates, signaling intensifying price competition [2]Source: Embrapa Food Technology, “Research develops lentil and chickpea protein concentrates,” embrapa.br.
Export-Driven Demand from Europe and Asia
Argentina shipments jumped 131% year-on-year to 140,000 metric tons in 2022, with Venezuela, China, and Brazil topping the client roster [3]Source: Bolsa de Comercio de Rosario, “Argentina pea production, exports, varieties, and prices,” bcr.com.ar. China's 100% tariff on Canadian yellow peas and India's duty-free imports have shifted buyer interest toward South American origins. This shift is driven by the competitive pricing and availability of yellow peas in the region. Additionally, the Megapuerto Chancay reduces Pacific transit times by 10-12 days, boosting Peru's freshness advantage and enabling faster delivery to key markets. This factor is projected to peak in the short term as trade flows adapt to tariff policies and improvements in port infrastructure, further influencing global supply chain dynamics.
Improved High-Yield Pea Cultivars
INTA’s PRIMOGENITA FCA-INTA (Facultad de Ciencias Agrarias-Instituto Nacional de Tecnología Agropecuaria) variety allows winter sowing 30-45 days ahead of legacy types and yields 2,909 kilograms per hectare versus 2,520 kilograms for standard spring peas. Peru’s National Institute for Agrarian Innovation (INIA) validated F9 families with superior pod quality for highland plots, though seeds will not reach scale before 2027. The shift from spring to winter varieties in Argentina enables double-cropping sequences with maize or sunflower, raising land-use efficiency and reducing per-hectare fixed costs, thereby lowering breakeven prices and supporting export competitiveness.
Government Soil-Health Incentives for Pulse Rotation
Argentina's export-tax reduction on soybeans failed to offset rising input costs and herbicide-resistance pressures, prompting an anticipated 1 million hectare decline in soybean area for MY2025/26 and freeing land for pulse rotation that improves soil nitrogen and breaks pest cycles. Nariño producers switched from cereals to peas after cereal sales collapsed, and the local government promoted the first National Pea Day in Córdoba to celebrate their nutritional and commercial value. Soil-health incentives contribute to medium-term impact as subsidy programs mature and farmer awareness of rotation benefits spreads.
Restraints Impact Analysis of South America Peas Market*
| Restraint | (~) % Impact on CAGR Forecast | Geographic Relevance | Impact Timeline |
|---|---|---|---|
| Competition from higher-margin soybeans | -0.4% | Argentina, Brazil, and Paraguay borders | Short term (≤ 2 years) |
| Inadequate pea-specific storage and handling | -0.3% | Colombia, Peru, Argentina secondary provinces | Medium term (2-4 years) |
| Yield volatility from Andean micro-climates | -0.5% | Peru, Colombia, and Bolivia borders | Long term (≥ 4 years) |
| Chinese phytosanitary import restrictions | -0.6% | Argentina, Peru, and regional exporters | Short term (≤ 2 years) |
| Source: Mordor Intelligence | |||
Competition from Higher-Margin Soybeans
Soybeans still produce larger gross margins in Argentina’s Pampas, reinforced by futures hedging and deep-water port access, even after a projected 1 million-hectare contraction in 2025-2026 plantings. Brazil's soybean expansion in the Cerrado and southern states directly competes with pulse rotation, as Bunge and Cargill's farmer-financing programs (USD 478 million in Brazil in 2024) prioritize oilseed procurement over pulses, limiting credit availability for pea growers. This restraint is concentrated in short-term horizons as farmers finalize planting decisions for MY2025/26 and MY2026/27 campaigns.
Inadequate Pea-Specific Storage and Handling
Colombia's Nariño smallholders (20,000-25,000 producers) lack dedicated pea storage facilities, forcing rapid post-harvest sales that depress farm-gate prices during peak-harvest months and prevent producers from capturing seasonal price premiums. Peru's highland departments (Cusco, Cajamarca, La Libertad) rely on multi-crop warehouses designed for cereals, where inadequate ventilation and moisture control increase aflatoxin risk and downgrade the quality of export-destined peas. This restraint reduces growth, with a medium-term impact, as infrastructure investments lag area expansion.
*Our forecasts treat driver/restraint impacts as directional, not additive. The impact forecasts reflect baseline growth, mix effects, and variable interactions.
Geography Analysis
Argentina Peas Market
Argentina secured 41.00% of the 2025 revenue share in the South America pea market by planting 83,000 hectares, setting a nine-year export record, benefiting from deepwater ports in Buenos Aires, Santa Fe, and Entre Ríos. Winter cultivars such as PRIMOGENITA FCA-INTA (Facultad de Ciencias Agrarias-Instituto Nacional de Tecnología Agropecuaria) allow sowing 30-45 days earlier than spring types, spreading harvest peaks and keeping storage elevators balanced. Lower soybean margins and government soil-health incentives are freeing land for pulse rotation, anchoring future volume gains even as farmers manage herbicide-resistant weeds. These factors position Argentina to defend a dominant slice of the South America pea market size through 2031.
Brazil Peas Market
Brazil posts the region’s fastest trajectory, with an 8.30% compound rate, as wet-extrusion capacity in Paraná processes 120-500 metric tons monthly, and draft labeling rules clarify plant-based product names. Grain traders extend soybean rail and port networks to support pulse procurement, trimming freight costs and providing processors with a reliable raw-material flow. Public seed research and private financing are driving new pea cultivars into the Cerrado and southern states, helping Brazil pivot from a net importer to a value-added exporter in the South America pea market. The shift reduces dependence on Canadian and Chinese isolates and raises domestic ingredient self-sufficiency.
Peru and Colombia Peas Market
Peru and Colombia provide complementary growth nodes. Megapuerto Chancay shortens Pacific sailings by 10-12 days, improving fresh-pea quality and supporting Lima’s rank among the country’s top agroexport lines in 2024. Peru's irrigation portfolio of USD 24 billion aims to expand 1 million hectares under irrigation, with pulse crops prioritized in highland zones, but project timelines stretch to 2030 and beyond, delaying yield-stabilization benefits. In Colombia, 20,000-25,000 Nariño smallholders cultivate 17,000 hectares, using cooperative logistics to reach Ecuador and interior retail chains. Extension services from the Unit for Rural Agricultural Planning raised national pea output 29% during the first half of 2025, rounding out regional supply diversity.
Regulatory Landscape
Pea trade and processing in South America is overseen by national plant-health authorities and increasingly digitized trade and quality-control systems. In Argentina, SENASA underpins phytosanitary compliance for plant products, and 2025 policy actions streamlined trade administration, including removal of the legacy import licensing framework and broader shifts toward electronic procedures for agri-commodity documentation.
Argentina also tightened traceability at the crop input level through INASE, which mandated fiscalized pea seed starting October 1, 2025. In Brazil, MAPA centralizes controls for plant products and border processes through the Portal Unico de Comercio Exterior (LPCO and Duimp modules), while Decree 12.709/2025 anchors MAPA-led identity and quality standards for plant products, drawing on Codex Alimentarius principles where specific national rules are not defined.
Value Chain Analysis
The value chain runs from seed and agronomy support (public research bodies such as INTA in Argentina and Embrapa in Brazil, and national seed control via INASE) through farming and aggregation into storage, cleaning, and primary processing. Argentina remains the main export-oriented hub, with production concentrated in provinces such as Buenos Aires, Cordoba, and Santa Fe and supported by deep-water export corridors, while traders and elevators increasingly integrate peas into existing oilseed logistics to lower freight and demurrage risk.
Downstream, processors convert peas into split peas, flours, concentrates, and textured ingredients for food and ingredient buyers. Wet-extrusion capacity cited for southern Brazil supports plant-based applications, while pea-specific storage and handling constraints among smallholders (notably in Colombia and Peru highlands) and moisture control requirements limit quality preservation. Limited industrialization outside leading corridors also pushes rapid post-harvest selling during peak harvest windows, constraining value-added exports.
Competitive Landscape
The South America pea market is growing as multinational grain houses leverage elevator networks and crushing plants to integrate pea fractionation alongside oilseed flows, driving logistics savings and stable off-take agreements. Santa Fe concentrates major Argentina’s soybean processing, letting operators co-locate pulse silos and split-pea lines that smooth export loading windows and lower demurrage risk. As a result, no single player holds more than 12% of revenue, giving the market a balanced mix of scale and contestability.
Processor differentiation focuses on food safety certifications and functional ingredient offerings. AGBM supplies protein concentrates certified under FSSC 22000 and ISO 14001, catering to European and North American buyers seeking non-genetically modified inputs. In Brazil, R&S Blumos is scaling wet extrusion technology for domestic plant-based meat brands, while Embrapa's (Empresa Brasileira de Pesquisa Agropecuária) research on protein concentrates introduces lentil and chickpea options, offering cost and flavor advantages over imported pea isolates. Venture capital and public grants are supporting pilot plants to produce fractional starch and fiber co-products, diversifying revenue streams beyond core protein sales.
Argentina’s National Seed Institute will mandate fiscalized pea seed starting October 2025, increasing compliance costs while improving traceability for export-focused processors. In Brazil, proposed nomenclature rules for plant-based alternatives permit the use of animal-related terms on product labels, provided the mimic is clearly indicated on the packaging. This offers domestic brands greater marketing flexibility but introduces additional design costs. Concurrently, antidumping duties imposed by the United States and Canada on Chinese pea protein are shifting buyer demand toward South American suppliers. This trend strengthens local fractionation economics and promotes further consolidation among mid-sized firms capable of meeting capacity and certification requirements.
Market Opportunities and Future Outlook
One opportunity is moving from bulk exports toward value-added pea ingredients and differentiated varieties that fit destination-market specifications. Argentina already combines export logistics with cultivar innovation (for example, INTA work on varieties and functional properties for protein recovery) and a growing share of yellow peas aligned with China-facing demand, which supports additional fractionation and contract-based supply that links certified seed, traceability, and consistent quality.
Peru provides another node where commercialization of value-added pea exports has been established, alongside logistics upgrades such as Megapuerto Chancay, which cuts Pacific transit times by 10-12 days and supports quality-sensitive shipments. In Brazil, domestic plant-based and ingredient formulations, supported by MAPA-led standardization and single-window trade processes, widen the addressable buyer base for pea-based ingredients among local manufacturers and international suppliers serving bakery, snacks, and meat-alternative formulations.
Recent Industry Developments in South America Peas Market
- May 2026: ADM expanded its soy and pea protein portfolio with eight new plant-based solutions, including pea flour positioned for bakery and cereal applications. The launch broadens formulation options for regional food manufacturers and supports greater pull-through for pea ingredients alongside other plant proteins.
- October 2025: Argentina's INASE implemented the requirement that pea seed be fiscalized starting October 1, 2025, tightening traceability rules across the planting material supply chain. The change increases compliance needs for growers and seed multipliers, while improving auditable sourcing for export-oriented processors.
- November 2024: Peru's Megapuerto Chancay commenced operations, reducing Asia transit times by 10-12 days and improving the competitiveness of quality-sensitive pea shipments. Faster logistics strengthens Peru's role in Pacific-facing trade lanes and supports higher-value export programs where freshness and condition drive pricing.


South America Peas Market Report Scope and Research Methodology
Market Definition and Coverage
For this study, the market is defined as the value of peas traded and consumed across South America, counted at the first point of sale in the supply chain and expressed in USD for the stated year.
Scope exclusions: We exclude retail margins, foodservice markups, and downstream processed pea ingredients that are priced as isolates, concentrates, or starches.
Segments Covered in This Report
- By Geography
- Argentina
- Production Analysis (Area Harvested, Yield, and Production Volume)
- Consumption Analysis (Consumption Value and Volume)
- Import Market Analysis (Import Value, Volume, and Key Supplying Markets)
- Export Market Analysis (Export Value, Volume, and Key Destination Markets)
- Wholesale Price Trend Analysis and Forecast
- Regulatory Framework
- List of Key Players
- Logistics and Infrastructure
- Seasonality Analysis
- Peru
- Production Analysis (Area Harvested, Yield, and Production Volume)
- Consumption Analysis (Consumption Value and Volume)
- Import Market Analysis (Import Value, Volume, and Key Supplying Markets)
- Export Market Analysis (Export Value, Volume, and Key Destination Markets)
- Wholesale Price Trend Analysis and Forecast
- Regulatory Framework
- List of Key Players
- Logistics and Infrastructure
- Seasonality Analysis
- Colombia
- Production Analysis (Area Harvested, Yield, and Production Volume)
- Consumption Analysis (Consumption Value and Volume)
- Import Market Analysis (Import Value, Volume, and Key Supplying Markets)
- Export Market Analysis (Export Value, Volume, and Key Destination Markets)
- Wholesale Price Trend Analysis and Forecast
- Regulatory Framework
- List of Key Players
- Logistics and Infrastructure
- Seasonality Analysis
- Argentina
Data Validation & Update Cycle
Before finalizing, model outputs are cross-checked against independent signals like production growth rates, trade balances, and implied per-capita availability, and any sharp breaks are reviewed to understand the driver. If variances cannot be explained by a known event, we re-check the source series, re-run the price normalization, and re-contact selected respondents to confirm what changed.
A second analyst reviews the calculation chain and assumptions before sign-off, and the results are compared with nearby pulse categories to ensure boundaries are consistent. Reports are refreshed annually, and interim updates are triggered when major shocks occur, such as tariff changes, extreme weather impacting yields, or sudden freight disruptions. Right before delivery, we do a fresh scan of public releases so clients receive the latest updated view.
How Mordor Intelligence's South America Peas Market Size Compares to Other Published Estimates
Published numbers for South America peas can differ more than buyers expect, mainly because the underlying boundary is not always the same and the price basis can shift the total quickly. We see the largest gaps when one estimate mixes fresh and dry forms without stating it clearly, or when trade values are converted using different currency timing for the same year.
Trade unit values and wholesale price trend checks, combined with production and net import totals, are the evidence that ties Mordor Intelligence to a peas-only demand pool without letting adjacent pulses or processed pea ingredients inflate the value. In addition, some publishers treat retail-priced consumption as the market, which naturally lands higher than a first-sale valuation used in this study.
Benchmark comparison
| Source | Market Size | Gaps in Research Methodology |
|---|---|---|
| Mordor Intelligence | USD 1.21 B (2025) | |
| Regional Consultancy A | USD 1.27 B (2023) | Uses a different base year and a broader country list, and the value appears closer to an end-market consumption view that can include more channel margin than first-sale pricing. |
| Trade Journal B | USD 3.80 B (2026) | Likely combines multiple pea forms and packaged categories and applies higher consumer-facing price points, which lifts totals versus a peas-only first transaction model. |
The spread in the table is mostly explained by what is being counted and at which price point the value is captured. By keeping the scope tied to peas at first sale and then checking totals against production, net trade, and realistic wholesale pricing, the final number stays traceable to inputs a buyer can review and repeat.


Key Questions Answered in the Report
How large is the South American pea market in value terms for 2026?
The market is projected to exceed USD 1.28 billion in 2026, tracking the 5.34% CAGR outlined in this report.
Which country leads current production of peas across South America?
Argentina tops regional output, accounting for 41.00% of 2025 revenue.
How do Chinese tariffs affect South American pea exports?
China's 100% tariff on Canadian peas redirects buyers to Argentine and Peruvian supply, lifting near-term shipment volumes and prices.
What infrastructure gaps hinder smallholder competitiveness?
Limited ventilated storage and handling facilities in Nariño, Cusco, and secondary Argentine provinces force distress sales that shrink farm income.
Are investments underway to localize protein-isolate production?
Yes, wet-extrusion and fractionation plants in Brazil and Argentina receive public and private funding to reduce reliance on imported isolates and strengthen value capture.
Page last updated on:






