
Market Overview
| Study Period | 2021 - 2031 |
|---|---|
| Market Volume (2026) | 1.27 Million tons |
| Market Volume (2031) | 1.45 Million tons |
| Growth Rate (2026 - 2031) | 2.69% CAGR |
| Fastest Growing Market | Middle East and Africa |
| Largest Market | Asia Pacific |
| Market Concentration | Medium |
Major Players *Disclaimer: Major Players sorted in no particular order Image © Mordor Intelligence. Reuse requires attribution under CC BY 4.0. | |
Refining Catalysts Market Analysis by Mordor Intelligence
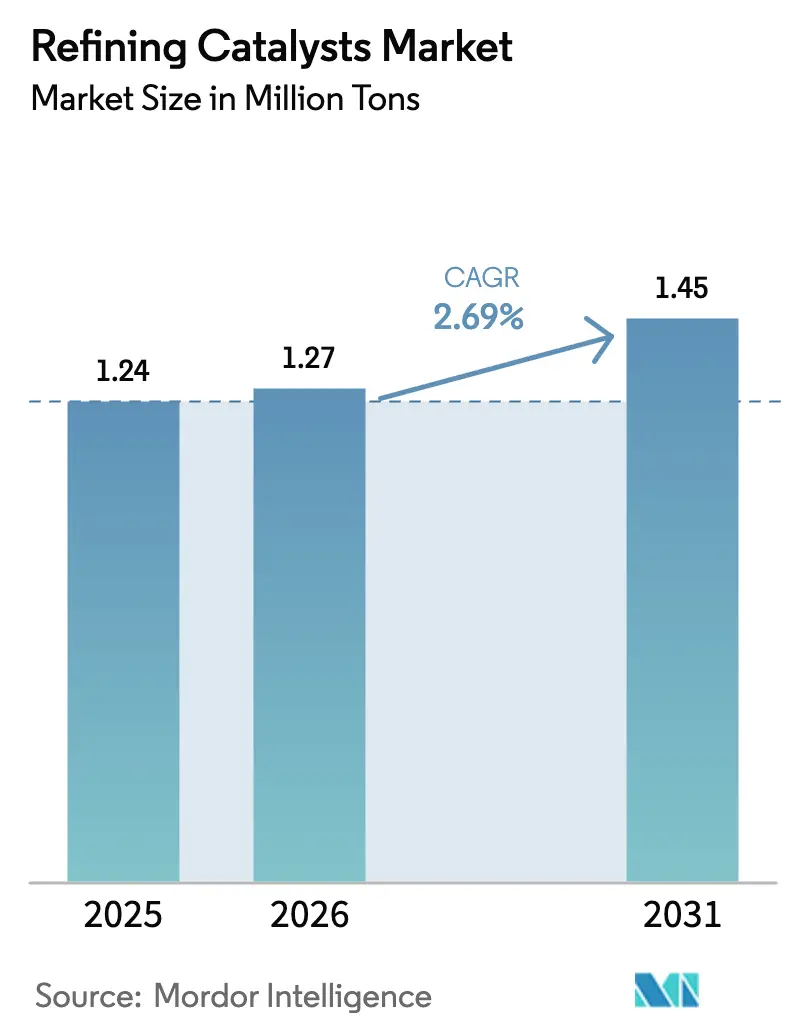
The Refining Catalysts Market size was valued at 1.24 Million tons in 2025 and is estimated to grow from 1.27 Million tons in 2026 to reach 1.45 Million tons by 2031, at a CAGR of 2.69% during the forecast period (2026-2031). These figures confirm the current refining catalysts market size and its steady growth trajectory amid tightening fuel-quality rules and evolving refinery configurations. The sector’s momentum reflects simultaneous tailwinds from strict sulfur-reduction mandates, expanding capacity in Asia-Pacific and the Middle East, and sustained demand for higher-octane gasoline even as electric-vehicle penetration climbs. Competitive strategies increasingly prioritize dual-function formulations that handle renewable feedstocks, while digital analytics extend catalyst cycles and optimize unit performance. Upstream volatility in cobalt and platinum-group metals inflates input costs, but suppliers counterbalance this pressure through substitution chemistries, recycling initiatives, and selective vertical integration that secures raw-material access.
Key Report Takeaways
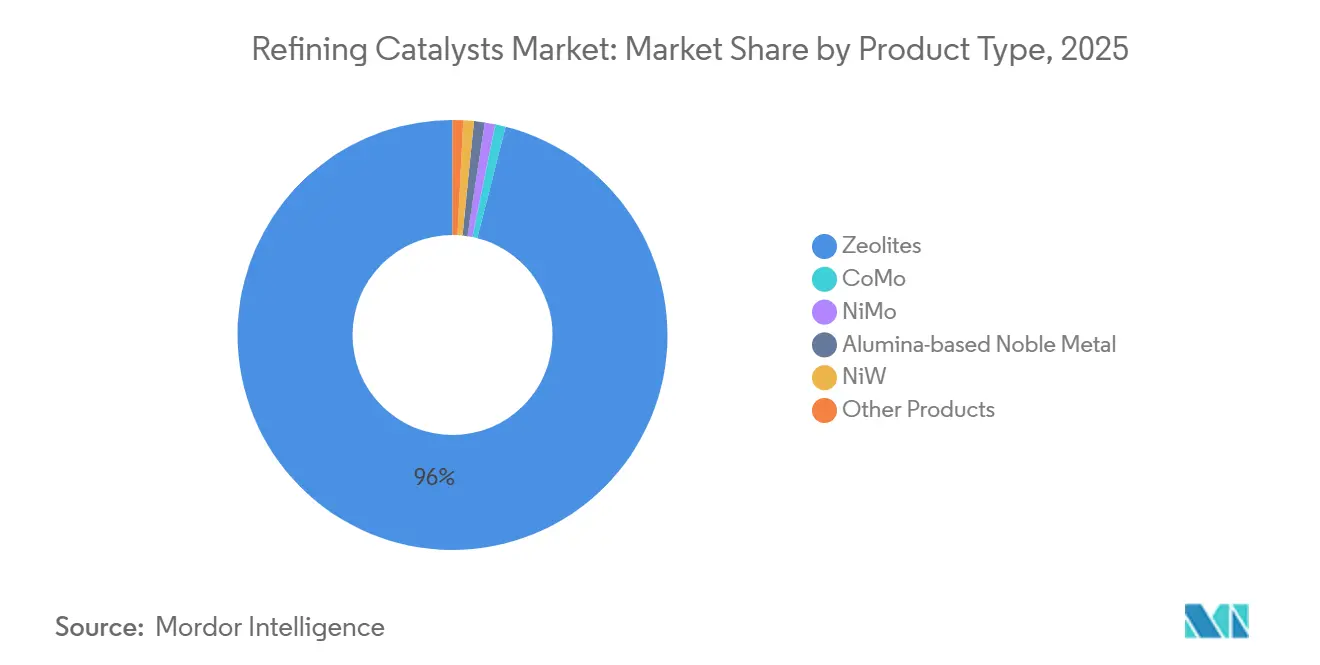
- By product type, zeolites held 96.01% of the refining catalysts market share in 2025 and are expected to grow with a CAGR of 2.72% through 2031.
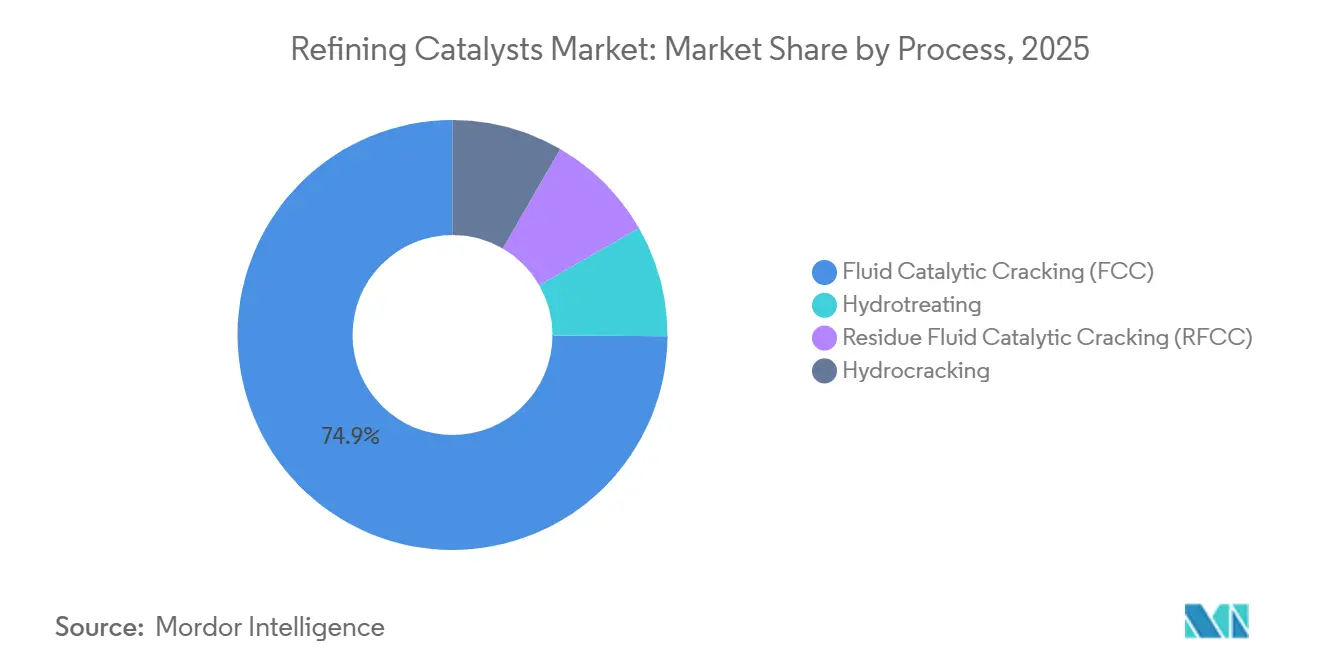
- By process, the fluid catalytic cracking (FCC) segment accounted for 74.91% of the refining catalyst market in 2025, and is anticipated to grow with a CAGR of 2.77% through 2031.
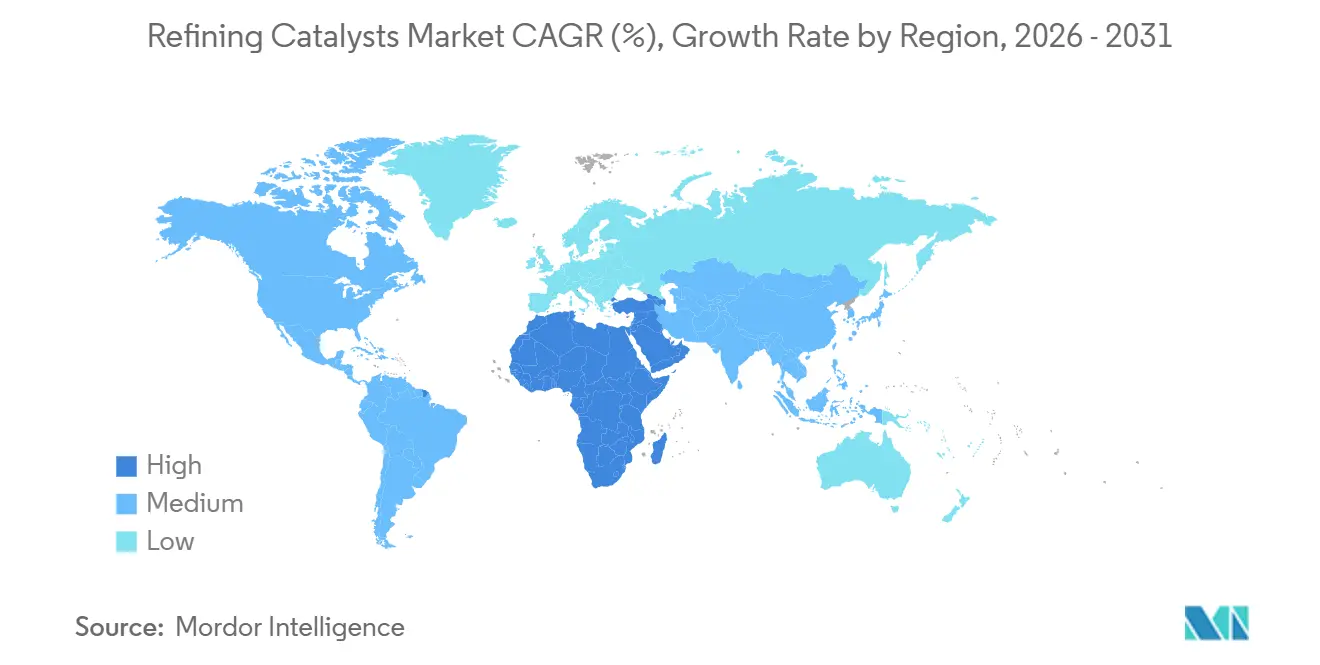
- By geography, Asia-Pacific retained the largest share of 52.03% of the refining catalysts market in 2025 and the Middle East and Africa region posts the fastest 2.78% CAGR through 2031.
Note: Market size and forecast figures in this report are generated using Mordor Intelligence’s proprietary estimation framework, updated with the latest available data and insights as of January 2026.
Global Refining Catalysts Market Trends and Insights
Drivers Impact Analysis*
| Drivers | (~) % Impact on CAGR Forecast | Geographic Relevance | Impact Timeline |
|---|---|---|---|
| Stricter global sulfur-cap regulations | +0.8% | Global, with peak intensity in Asia-Pacific and Europe | Short term (≤ 2 years) |
| Refinery capacity build-out in Asia-Pacific and Middle East | +0.9% | Asia-Pacific core (China, India, ASEAN), Middle East (Saudi Arabia, Kuwait, UAE) | Medium term (2-4 years) |
| Rising demand for higher-octane gasoline and petro-feedstocks | +0.5% | North America, Europe, select Asia-Pacific markets | Medium term (2-4 years) |
| Bio-feed co-processing needs dual-function catalysts | +0.3% | Europe, North America, with early adoption in Brazil | Long term (≥ 4 years) |
| AI-driven catalyst performance analytics adoption | +0.2% | Global, led by integrated refiners in North America and Europe | Long term (≥ 4 years) |
| Source: Mordor Intelligence | |||
Stricter Global Sulfur-Cap Regulations
The International Maritime Organization’s 0.50% sulfur limit for marine fuels, effective since January 2020, still reverberates across coastal refineries that now hydrotreat residual streams to supply compliant bunker blends. China’s nationwide China VI gasoline and diesel standards, implemented in 2024, limit sulfur to 10 ppm and forced state-owned refiners to add hydrotreating capacity equal to nearly 1.2 million barrels per day of throughput. The United States Environmental Protection Agency’s Tier 3 gasoline program maintains a comparable 10 ppm cap, bolstering demand for noble-metal alumina catalysts that reach deep desulfurization under moderate hydrogen partial pressures. Europe’s Fuel Quality Directive replicates the 10 ppm threshold, reinforcing NiMo and CoMo demand throughout the continent. Overlapping mandates deliver a 0.8 percentage-point uplift to the base CAGR mainly through 2026 as multiple deadlines converge.
Refinery Capacity Build-Out in Asia-Pacific and Middle East
Greenfield and brownfield projects in China, India, Saudi Arabia, and Kuwait add roughly 3 million barrels per day of crude distillation between 2024 and 2028, translating into multi-ton catalyst charges for FCC, hydrotreating, and hydrocracking units. Saudi Aramco and China Petrochemical Corporation’s Fujian complex will consume an estimated 12,000 tons of zeolite FCC catalysts annually at full stride, while India’s Panipat, Gujarat, and Barauni expansions boost local hydrotreating demand through 2027. Kuwait’s Al-Zour refinery processes 615,000 barrels per day of heavy crude, relying on NiW and CoMo residue hydrocracking catalysts to maximize middle-distillate yields. The combined build-out contributes a 0.9 percentage-point push to the forecast CAGR, peaking as these new units reach nameplate throughput over 2026-2028.
Rising Demand for Higher-Octane Gasoline and Petro-Feedstocks
Turbocharged engines and hybrid powertrains support ongoing demand for 95 RON and 98 RON gasoline grades even where total gasoline volumes plateau. Modern FCC units equipped with rare-earth Y-zeolites lift octane by 2-3 numbers without sacrificing conversion efficiency. Petrochemical complexes simultaneously prize propylene and butylene, prompting refiners to deploy ZSM-5 additives that raise light-olefin yield by up to 15% in commercial service[1]BASF SE, “ZSM-5 Additive Raises Propylene Yield,” BASF Press Release, basf.com . North American operators follow the same path: ExxonMobil’s Beaumont expansion, finished in 2024, added 250,000 barrels per day of crude capacity through FCC trains tailored for propylene recovery. The octane and petro-feedstock push adds 0.5 percentage points to the CAGR with medium-term resonance.
Bio-Feed Co-Processing Needs Dual-Function Catalysts
Renewable diesel and sustainable aviation fuel mandates in Europe and North America force refiners to co-process vegetable oils or waste fats that challenge conventional hydrotreating catalysts. Shell’s Pernis refinery accommodates up to 30% bio-derived feedstocks by deploying NiMo catalysts tolerant of oxygenates and coking precursors. Topsoe’s HydroFlex technology, running at more than 10 sites by late 2025, integrates hydro-deoxygenation with saturation reactions to secure renewable diesel yields above 90%. Combined policies under the United States Renewable Fuel Standard and California’s Low Carbon Fuel Standard mandate roughly 15 billion liters of renewable diesel a year by 2027, generating an incremental 2,500 tons of catalyst demand annually. This driver contributes 0.3 percentage points to growth with long-term momentum.
Restraints Impact Analysis*
| Restraints | (~) % Impact on CAGR Forecast | Geographic Relevance | Impact Timeline |
|---|---|---|---|
| Volatility in cobalt, PGMs, and other critical metals | -0.4% | Global, with acute pressure in Europe and North America | Short term (≤ 2 years) |
| EV penetration curbing long-term gasoline demand | -0.5% | Europe and China core, spreading to North America | Medium term (2-4 years) |
| Crude-to-chemicals complexes bypass traditional units | -0.3% | Middle East and Asia-Pacific, with Saudi Arabia and China leading | Long term (≥ 4 years) |
| Source: Mordor Intelligence | |||
Volatility in Cobalt, PGMs, and Other Critical Metals
Cobalt prices rose 18% in 2025 on tight supply from the Democratic Republic of Congo, while platinum and palladium climbed 12% amid South African output curbs. CoMo hydrotreating catalysts that contain 2-4% cobalt by weight face margin compression because regulated fuel prices limit pass-through. Platinum-bearing reforming catalysts see similar strain: a 10% palladium rise inflates finished-catalyst cost by roughly USD 50 per kilogram. Suppliers pursue cobalt-free NiW chemistries and accelerate recycling to cushion volatility, yet commercialization may take two to three years. Price swings trim 0.4 percentage points from the base CAGR, with most impact between 2024 and 2026 as refiners lengthen change-out intervals.
EV Penetration Curbing Long-Term Gasoline Demand
Battery-electric vehicle sales reached 14 million units in 2025, removing nearly 200,000 barrels per day of gasoline demand, and the International Energy Agency expects that figure to triple by 2030[2]International Energy Agency, “World Energy Outlook 2025,” IEA, iea.org . Europe’s gasoline use dropped 6% between 2019 and 2025 as the electric-vehicle share surpassed 25% of new car sales in Norway, the Netherlands, and Germany. China’s gasoline plateaued at 3.2 million barrels per day by 2024, with plug-in vehicles representing 38% of passenger-car sales in 2025. These shifts erode FCC throughput, cut absolute zeolite volume per barrel, and subtract 0.5 percentage points from growth with medium-term prominence.
*Our forecasts treat driver/restraint impacts as directional, not additive. The impact forecasts reflect baseline growth, mix effects, and variable interactions.
Segment Analysis
By Product Type: Zeolites Anchor FCC Economics
Zeolites captured 96.01% of the refining catalysts market share in 2025 and are expected to grow 2.72% annually through 2031. This extensive dominance underscores how the refining catalysts market revolves around FCC operations that crack vacuum gas oil into gasoline, diesel, and light olefins. Rare-earth Y-zeolites remain the workhorse at riser temperatures of 500 °C-550 °C, while ZSM-5 additives lifted propylene production. CoMo catalysts are primarily utilized in Asian and Middle Eastern hydrotreaters processing high-sulfur feeds. NiMo formulations are preferred by aviation fuel refiners for kerosene desulfurization. Alumina-supported noble-metal products play a niche role in reforming applications, as the volatility of precious metals limits broader adoption. NiW catalysts are commonly used for residue hydrocracking in heavy-crude regions. Experimental solutions, such as metal-organic frameworks, are also being explored. Clariant’s planned 2025 launch of a hierarchical zeolite combining micro- and mesopores highlights incremental innovation within the dominant segment.
The upcoming replacement cycle underscores the sustained demand for zeolite formulations, despite the impact of electric vehicle adoption. Asia-Pacific FCC units designed for petrochemical integration are specifying higher ZSM-5 doses, while Middle Eastern residue hydrocrackers are favoring NiW systems with enhanced metal tolerance, contributing to market diversity. Cobalt-free NiW formulations entering pilot trials may eventually capture share from CoMo in diesel hydrotreaters, but commercialization is unlikely before 2028, suggesting a stable competitive mix through the midpoint of the forecast window.



By Process: FCC Dominance Masks Hydrotreating Growth
Fluid catalytic cracking accounted for 74.91% of 2025 catalyst volume and is set to expand at a 2.77% CAGR from 2026 to 2031, aligning with the refining catalysts market growth pattern in emerging hubs. Hydrotreating processes play a significant role in refining, with diesel hydrotreating being the most prominent, followed by vacuum-gas-oil hydrotreating, kerosene, gasoline, catalytic-cracking gasoline, and residual feeds. China's implementation of a 10 ppm sulfur cap for diesel and gasoline has driven increased demand for NiMo and CoMo catalysts across its national refinery network. Similarly, the United States' Tier 3 rule has boosted the use of noble-metal alumina formulations designed to reduce hydrogen consumption. Hydrocracking is particularly favored in regions such as India and the Middle East, where refiners focus on maximizing middle-distillate yields. Residue FCC remains essential in facilities lacking coking units. The co-processing of bio-feeds is increasingly blurring process boundaries. For example, Shell's renewable-feed run in a hydrocracker employs dual-function catalysts that combine hydrotreating and hydrodeoxygenation, indicating a gradual convergence of catalyst families.
The role of hydrotreating is expected to grow steadily over the forecast period, as new sulfur regulations and renewable diesel mandates directly expand the demand for catalytic desulfurization. While FCC retains its dominance in refining processes, a growing proportion of its output is being directed toward propylene and butylene production, leading to changes in zeolite specifications rather than overall tonnage. This process diversification supports the refining catalysts market, even as overall gasoline demand stabilizes.
Geography Analysis
Asia-Pacific accounted for a 52.03% share of the global refining catalyst market in 2025. China and Saudi Aramco’s Fujian complex will eventually draw 12,000 tons of zeolite annually, and Indian expansions add significant hydrocracking demand under Albemarle’s USD 45 million contract. Southeast Asian projects in Indonesia, Vietnam, and Thailand add about 500,000 barrels per day of distillation capacity through 2028, broadening hydrotreating and FCC opportunities.
North America and Europe face refinery shutdowns and electric-vehicle-driven gasoline decline. Europe’s 6% gasoline retreat from 2019-2025 and North American unit reconfiguration toward propylene and diesel reshape catalyst specifications rather than spark volume growth. The United States Tier 3 rule keeps noble-metal demand steady, and Canada’s oil-sands upgraders sustain specialized hydrocracking volume. Yet the refining catalysts market in these mature regions edges sideways as plant rationalization offsets unit upgrades.
In South America, Argentina’s La Plata hydrocracker, scheduled for 2027, adds 600 tons of annual demand. These incremental additions solidify the region’s leadership in growth rate terms, even if Asia alone retains absolute volume dominance.
The Middle East and Africa are witnessing a significant rise in demand for refining catalysts with the fastest 2.78% CAGR from 2026 to 2031. Saudi Arabia’s liquids-to-chemicals agenda and Kuwait’s Al-Zour heavy-crude platform generate constant demand for residue hydrocracking catalysts. Africa presents long-term upside through Nigeria’s 650,000 barrels-per-day Dangote refinery, which when fully loaded in 2026 will require roughly 5,000 tons of FCC and hydrotreating catalysts each year. South Africa’s Secunda gas-conversion retrofit will lift hydrotreating volume by 15%.

Regulatory Landscape
Fuel-quality and emissions mandates remain the main downstream compliance drivers for refining catalyst demand and specification, including 10 ppm sulfur caps under China VI (implemented in 2024), the US EPA Tier 3 gasoline program, and the EU Fuel Quality Directive. At the same time, chemical-management requirements increasingly affect catalyst manufacturing and cross-border movement, particularly for formulations that include hazardous substances or engineered nano-forms used in specialty catalyst products.
In 2026, regulatory emphasis shifted further toward chemical compliance and plant-level emissions controls. In the European Union, the European Commission advanced work under the REACH Restrictions Roadmap (July 2026), and ECHA actions placed more weight on continuous dossier maintenance; updates tied to nano-form data and supply-chain documentation increased the administrative burden for catalyst exporters to the EU. In the United States, the EPA finalized amendments to NESHAP for Chemical Manufacturing Area Sources (CMAS) in April 2026, including enhanced leak detection and repair and related compliance reporting for in-scope chemical operations, which supports the case for tighter operational controls across catalyst production and handling.
Value Chain Analysis
The refining catalysts value chain spans specialty raw materials (zeolite precursors, alumina supports, rare earths, and critical metals such as cobalt and platinum-group metals), then formulation, spray drying or extrusion, calcination, quality testing, and logistics to refinery units including FCC, hydrotreating, hydrocracking, and reforming. Refiners typically procure under long-term supply agreements that bundle technical service, catalyst management, and performance guarantees, with change-out cycles and regeneration practices shaping annual volumes and inventory planning.
Recent company actions show how the chain is being reorganized through ownership changes, localized capability build-outs, and co-development with refiners. Albemarle completed the sale of a controlling stake in Ketjen to KPS Capital Partners in March 2026, and Ketjen signed a joint development agreement with Saudi Aramco Technologies Company focused on next-generation FCC catalysts and additives, tightening the link between catalyst R&D and refinery-specific performance targets. BASF also opened a refinery-catalysts R&D center at its Attapulgus, Georgia site in May 2026 to accelerate scale-up and testing. Separately, Shell Catalysts & Technologies signed a licensing agreement with ENGIE in June 2026 for the KerEAUzen eSAF project in Le Havre, indicating how process know-how is extending into low-carbon fuel value chains.
Competitive Landscape
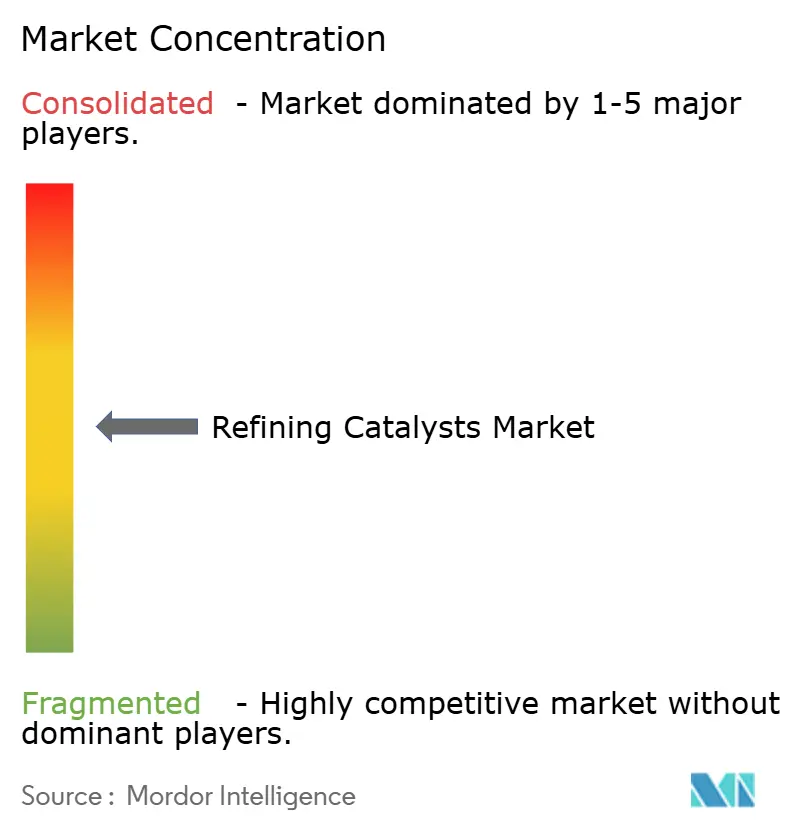
The global refining catalyst market is moderately consolidated, with leading players accounting for a significant share of the global volume. Regional firms such as China Petroleum & Chemical Corporation’s catalyst subsidiaries address captive and local demand. Dual-function formulations that co-process renewable fats alongside petroleum streams gain strategic focus. Digital analytics now underpin most new offerings. Patent filings show intensified research into cobalt-free NiW systems and hierarchical zeolites that improve diffusion and manage heavier feeds. Closed-loop concepts present untapped value, with fewer than 20% of refiners applying systematic FCC catalyst regeneration even though rare-earth recovery rates can exceed 80%.
White-space innovation includes early-stage metal-organic frameworks that promise high surface areas and tunable pore architecture ideal for selective hydrogenation. Commercial entry is unlikely before 2030, but pilot successes could disrupt alumina supports in specialty applications. Technology adoption bifurcates between integrated majors exploiting AI optimization and independent emergent-market operators relying on proven low-cost chemistries, sustaining a diversified competitive ecosystem.
Refining Catalysts Industry Leaders
W. R. Grace & Co.-Conn
Albemarle Corporation
BASF SE
Honeywell International
Topsoe
- *Disclaimer: Major Players sorted in no particular order

Market Opportunities and Future Outlook
Refiners and technology licensors are expanding catalyst use beyond conventional transport fuels into petrochemical integration and lower-carbon fuels, which creates room for advanced zeolite architectures and dual-function hydroprocessing catalysts. The market is also drawing more demand for localized supply and technical support tied to new capacity additions, supported by regional production expansions and refinery-linked catalyst contracts.
A near-term opportunity centers on mesoporized and diffusion-optimized zeolites that improve selectivity and stability on heavier and renewable-derived feeds. In April 2026, Evonik launched a new generation of isodewaxing catalysts incorporating Zeopore mesoporized zeolite technology, pointing to commercialization of improved pore-structure designs for yield uplift in fuel and lubricant production. As refineries reconfigure toward petrochemical outputs, Honeywell secured an April 2026 contract to provide technologies and catalysts supporting Dangote's petrochemical expansion at the Lekki refinery in Nigeria, including 750,000 tpy of propylene and 400,000 tpy of linear alkylbenzene capacity, tying catalyst demand to propylene-focused and specialty chemical units. Collaboration models also remain a practical route into these opportunities: Ketjen and Saudi Aramco Technologies Company signed a joint development agreement in March 2026 to co-develop and deploy next-generation FCC catalysts and additives, aligning catalyst innovation with refinery operating windows and feedstock requirements.
Recent Industry Developments
- July 2026: Topsoe signed an agreement with J Westling & Co (JWC) to deliver SynCOR Ammonia technology and catalysts for a blue ammonia fertilizer facility in Gothenburg, Nebraska. The award reinforces demand for high-performance catalyst systems tied to hydrogen and ammonia value chains that overlap with refinery hydrogen production, purification, and catalyst know-how. It also broadens Topsoe's project pipeline beyond traditional refinery units while keeping catalyst supply central to the delivery model.
- March 2026: Ketjen and Saudi Aramco Technologies Company signed a joint development agreement to co-develop and deploy next-generation FCC catalysts and additives. The collaboration aligns catalyst innovation with refinery feedstock needs and modernizes cracking capabilities across both parties' portfolios. It strengthens the pipeline for next-generation FCC solutions and supports shared investment in testing and field deployment.
- August 2024: BASF introduced the Fourtiva fluid catalytic cracking (FCC) catalyst featuring its Advanced Innovative Matrix (AIM) and Multiple Frameworks Topology (MFT) technologies to improve high-octane gasoline blending. The launch targets refineries optimizing FCC operations for higher-value gasoline and petrochemical feedstocks, where additive and catalyst selection directly affects yields and product specs. It also adds competitive pressure in the dominant FCC catalyst segment, where zeolites account for the vast majority of global catalyst volume.


Research Methodology Framework and Report Scope
Market Definition and Coverage
This market covers catalysts consumed in petroleum refineries that help convert and treat crude-derived streams into fuels and other refinery products, counted based on catalyst use and replacement over time.
Scope exclusions: Excluded from scope are catalysts used mainly for petrochemical synthesis outside refineries, along with non-catalytic refining additives.
Segmentation Overview
- By Product Type
- CoMo
- NiMo
- Alumina-based Noble Metal
- NiW
- Zeolites
- Other Products
- By Process
- Hydrotreating
- Gasoline
- Kerosene
- Diesel
- Vacuum Gas Oil
- Catalytic-Cracking Gasoline
- Residual Feed
- Fluid Catalytic Cracking (FCC)
- Residue Fluid Catalytic Cracking (RFCC)
- Hydrocracking
- Hydrotreating
- By Geography
- North America
- United States
- Canada
- Mexico
- South America
- Brazil
- Argentina
- Rest of South America
- Europe
- Germany
- United Kingdom
- Italy
- France
- Spain
- Russia
- Rest of Europe
- Asia-Pacific
- China
- India
- Japan
- South Korea
- ASEAN Countries
- Rest of Asia-Pacific
- Middle-East and Africa
- South Africa
- Saudi Arabia
- Rest of Middle-East and Africa
- North America
Data Validation & Update Cycle
Model outputs were checked against independent signals, including refinery throughput direction, announced capacity changes, and whether implied catalyst intensity matched what practitioners described for similar unit sets. If an anomaly appeared, such as a step change in tonnage without a matching utilization or turnaround driver, the input stack was reviewed and the relevant experts were re-contacted for clarification.
Before sign-off, the calculations and assumptions go through multi-step analyst reviews so that unit conversions, regional roll-ups, and growth drivers remain consistent. Reports are refreshed annually, with interim updates when material events occur, such as major refinery closures, large capacity start-ups, or meaningful fuel-spec changes. Right before delivery, a fresh pass is completed so clients receive the latest updated view.
Mordor Intelligence's Refining Catalysts Market Size Compared With Other Published Estimates
Published market sizes can differ a lot because some sources measure revenue while others measure physical consumption, and because the same word, catalysts, can be applied to different product baskets. Differences also come from how refill cycles are modeled, how refinery activity is proxied, and how price changes and currency timing are treated.
The main gap comes from mixing revenue-based totals with volume-based totals, where Mordor Intelligence keeps the scope in tons tied to refinery runs, unit mix, and replacement cycles, instead of converting to USD using broad average selling price assumptions.
Benchmark comparison
| Source | Market Size | Gaps in Research Methodology |
|---|---|---|
| Mordor Intelligence | USD 1.24 M (2025) | |
| Global Consultancy A | USD 10.10 B (2025) | This figure is stated in revenue terms, so the result can shift materially based on how average catalyst pricing is set across unit types and how price escalation is applied through the forecast. |
| Industry Publisher B | USD 6.00 B (2024) | This estimate uses a different base year and a revenue lens, and it may smooth demand using a single growth path without explicitly rebalancing for turnaround timing, changing unit mix, and regional utilization differences. |
The comparison shows that unit-of-measure and scope alignment drive most of the spread, so the numbers should only be compared when they are built on the same basis. When the model is anchored to utilization, unit configuration, and observed replacement cadence, the resulting trajectory stays traceable to clear operating drivers and can be refreshed consistently as those drivers move.


Key Questions Answered in the Report
What volume does the refining catalysts market reach by 2031?
The refining catalysts market reaches 1.45 million tons by 2031, growing at a 2.69% CAGR across the forecast interval.
Which product type leads the worldwide demand for refining catalysts?
Zeolite-based catalysts dominate, holding 96.01% of 2025 volume due to their critical role in FCC units.
Which region posts the fastest growth for refining catalysts after 2026?
The Middle East and Africa record the quickest 2.78% CAGR from 2026 to 2031, supported by large-scale capacity additions and liquids-to-chemicals projects.
How do sulfur regulations influence catalyst consumption?
Stringent 10 ppm sulfur limits for gasoline and diesel in major economies spur sustained hydrotreating demand, adding approximately 0.8 percentage points to overall CAGR.
Why are cobalt-free catalysts gaining attention?
Volatile cobalt prices inflate CoMo production costs, pushing suppliers toward cobalt-free NiW formulations that match activity while lowering exposure to critical-metal swings.
How is digital technology changing catalyst life cycles?
Machine-learning platforms from firms such as Honeywell and Topsoe predict deactivation and optimize regeneration, extending catalyst service life by up to 15% while maintaining unit reliability.
Page last updated on:






