
Phthalic Anhydride Market Size and Share
Market Overview
| Study Period | 2021 - 2031 |
|---|---|
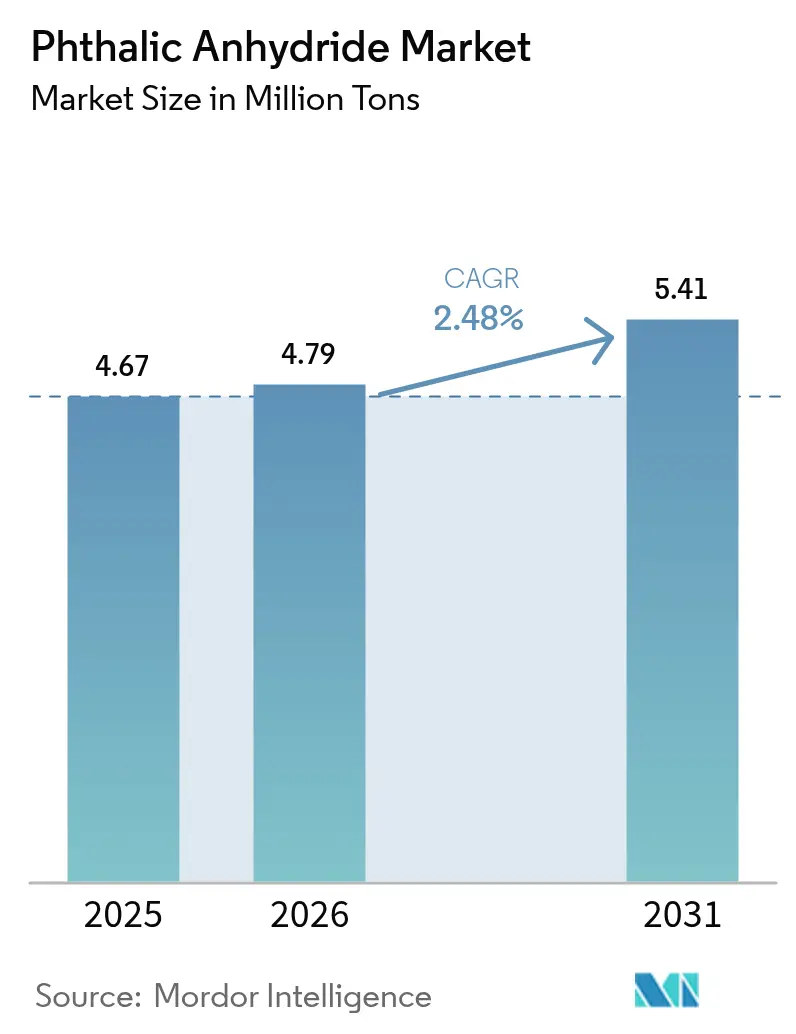
| Market Volume (2026) | 4.79 Million tons |
| Market Volume (2031) | 5.41 Million tons |
| Growth Rate (2026 - 2031) | 2.48% CAGR |
| Fastest Growing Market | Asia Pacific |
| Largest Market | Asia Pacific |
| Market Concentration | Medium |
Major Players *Disclaimer: Major Players sorted in no particular order Image © Mordor Intelligence. Reuse requires attribution under CC BY 4.0. | |
Phthalic Anhydride Market Analysis by Mordor Intelligence
The Phthalic Anhydride Market size is expected to increase from 4.67 million tons in 2025 to 4.79 million tons in 2026 and reach 5.41 million tons by 2031, growing at a CAGR of 2.48% over 2026-2031. Global demand is realigning as coal-tar–based naphthalene supply tightens, while new ortho-xylene routes in Asia intensify margin pressure on Western plants. Price weakness in China, where spot values fell 9.6% in 2025, mirrors average operating rates of 50–75% and highlights persistent oversupply even as electric-vehicle wiring and wind-turbine composites lift consumption in specialty niches. Regional policy shifts add another layer: India’s USD 37 billion petrochemical program will raise intermediate self-sufficiency, and the European Union now classifies phthalic anhydride as a respiratory sensitizer, accelerating phthalate-free reformulation. Producers that combine captive feedstock with ISO 9001 quality systems are best placed to defend margins as global oil-to-chemicals complexes continue to swell aromatics supply.
Key Report Takeaways
- By raw material, naphthalene accounted for 83.18% share of the phthalic anhydride market size in 2025; ortho-xylene is projected to register the fastest 3.31% CAGR between 2026 and 2031.
- By application, plasticizers commanded 54.71% of the phthalic anhydride market share in 2025, while unsaturated polyester resins are set to grow at a 4.41% CAGR to 2031.
- By end-user industry, automotive captured 51.88% of the phthalic anhydride market size in 2025, yet electrical and electronics is advancing at a 4.15% CAGR through 2031.
- By geography, Asia-Pacific held 61.78% of the phthalic anhydride market share in 2025, and is expected to post a CAGR of 3.22% through 2031.
Note: Market size and forecast figures in this report are generated using Mordor Intelligence’s proprietary estimation framework, updated with the latest available data and insights as of 2026.
Global Phthalic Anhydride Market Trends and Insights
Drivers Impact Analysis*
| Driver | (~) % Impact on CAGR Forecast | Geographic Relevance | Impact Timeline |
|---|---|---|---|
| Expansion of UPR use in wind-turbine blades | +0.6% | Global, with concentration in Asia-Pacific (China, India) and Europe (Germany, Denmark) | Medium term (2–4 years) |
| Electric-vehicle wire-and-cable plasticizer boom | +0.7% | Asia-Pacific (China, Japan, South Korea), North America (United States), Europe (Germany) | Medium term (2–4 years) |
| Capacity additions by low-cost Asian producers | +0.5% | Asia-Pacific (China, India, Southeast Asia) | Short term (≤ 2 years) |
| PAN-based MOFs for carbon capture and utilisation | +0.2% | Global, early adoption in Europe and North America | Long term (≥ 4 years) |
| Electro-additive role in high-voltage Li-ion cells | +0.3% | Asia-Pacific (China, Japan, South Korea), North America | Long term (≥ 4 years) |
| Source: Mordor Intelligence | |||
Expansion of UPR Use in Wind-Turbine Blades
Wind-energy capacity additions are reshaping unsaturated polyester resin demand, which in turn pulls phthalic anhydride consumption upward. Global wind-turbine installations require composite blades that blend glass fiber with UPR matrices, and each megawatt of offshore capacity consumes approximately 15–20 tons of composite material. China brought more than 70 GW online in 2025, while India targets 500 GW of renewables by 2030, driving sustained pull for high-purity phthalic anhydride in corrosion-resistant resin systems[1]Ministry of New and Renewable Energy, “Annual Report 2025-26,” mnre.gov.in. Offshore projects in the North Sea and Taiwan Strait further amplify demand, as marine environments mandate resin systems with superior hydrolytic stability, a performance attribute directly linked to phthalic anhydride's aromatic backbone rigidity.
Electric-Vehicle Wire-and-Cable Plasticizer Boom
Electric-vehicle architectures require wire harnesses rated for 400–800 volt systems, and cable insulation must withstand thermal cycling, electromagnetic interference, and mechanical abrasion over 15-year service lives. Each battery electric vehicle carries up to 2 km of cabling that requires 3–4 kg of plasticized PVC. Global EV output topped 14 million units in 2025, lifting phthalate ester consumption for DINP and DIDP despite parallel interest in DOTP and DINCH alternatives to meet REACH limits of 0.1 wt% on legacy ortho-phthalates[2] International Energy Agency, “Global EV Outlook 2026,” iea.org.
Capacity Additions by Low-Cost Asian Producers
Asia-Pacific producers commissioned over 300,000 tons of new phthalic anhydride capacity in 2024–2025, with IG Petrochemicals' 80,000-ton greenfield plant in India (INR 6,000 million investment) and Aekyung's 50,000-ton Ningbo expansion leading the wave. These projects leverage integrated naphtha crackers and captive ortho-xylene streams, achieving cash costs 15–20% below Western producers who rely on merchant feedstock. China’s 2025–26 high-quality petrochemical plan links construction permits to environmental audits, concentrating new capacity within large groups and intensifying global oversupply.
PAN-Based MOFs for Carbon Capture and Utilisation
Polyacrylonitrile-based metal-organic frameworks incorporating phthalic acid linkers represent an emerging frontier in post-combustion CO₂ capture. These frameworks achieve surface areas exceeding 3,000 square meters per gram and demonstrate selective adsorption of CO₂ over nitrogen at flue-gas concentrations (10–15% CO₂). Pilot installations at coal-fired power stations in China and cement kilns in Europe have validated capture efficiencies above 85%, with regeneration cycles stable beyond 1,000 cycles. If EU carbon-border taxes escalate, MOF demand could jump toward 15,000 tons of ultra-pure phthalic anhydride by 2030, introducing a niche premium outlet for producers able to meet sub-ppm chloride specifications.
Restraints Impact Analysis*
| Restraint | (~) % Impact on CAGR Forecast | Geographic Relevance | Impact Timeline |
|---|---|---|---|
| Shift toward bio-based anhydrides in coatings | -0.4% | Europe, North America | Medium term (2–4 years) |
| Declining coal-tar supply for naphthalene route | -0.5% | North America, Europe, select Asia-Pacific markets | Short term (≤ 2 years) |
| Phthalate-free alkyd chemistries gaining share | -0.3% | Global, with fastest adoption in Europe | Medium term (2–4 years) |
| Source: Mordor Intelligence | |||
Shift Toward Bio-Based Anhydrides in Coatings
Alkyd resin formulators are substituting phthalic anhydride with azelaic acid, fumaric acid, and lignin-derived aromatic monomers to meet sustainability targets and reduce Scope 3 emissions. Perstorp's ISCC PLUS-certified plant in Sayakha, India, commissioned in 2024, produces mass-balanced polyols and intermediates from renewable feedstocks, enabling paint manufacturers to claim up to 70% bio-content without reformulation. European paint makers now substitute 8–10% of phthalic feedstock with azelaic or lignin-derived acids, leveraging Perstorp’s ISCC PLUS materials that enable 70% bio-content claims. Decorative lines move first because label marketing offsets the 20–30% price premium, while automotive OEM topcoats still rely on phthalic chemistry for hardness and weatherability.
Declining Coal-Tar Supply for Naphthalene Route
Naphthalene feedstock availability is tightening as steel mills reduce coke-oven operations and petrochemical crackers favor lighter feeds. Global coal-tar production declined approximately 3% annually from 2020 to 2025, driven by electric-arc furnace adoption in steelmaking and natural-gas displacement of metallurgical coal in blast furnaces. Koppers' exit from phthalic anhydride production in North America, triggered by naphthalene supply constraints and USD 51–55 million in asset write-downs, illustrates the structural risk for non-integrated producers. Importing naphthalene into China from India and the Middle East erodes the historic cost advantage of coal-tar processing.
*Our forecasts treat driver/restraint impacts as directional, not additive. The impact forecasts reflect baseline growth, mix effects, and variable interactions.
Segment Analysis
By Raw Material: Naphthalene Dominance Erodes Amid Feedstock Scarcity
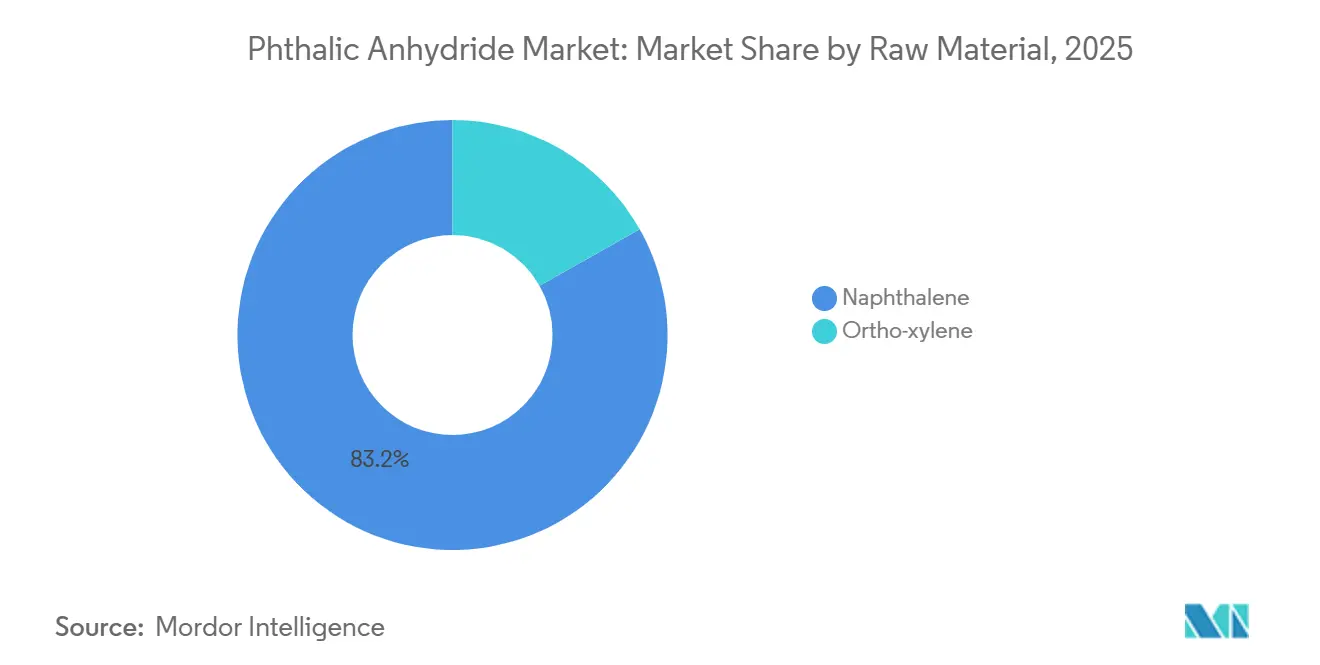
Naphthalene retained 83.18% of 2025 feedstock, yet tightening coal-tar supply and Western plant closures signal a structural pivot. Ortho-xylene, supported by integrated aromatics streams, is set for a 3.31% CAGR and will gradually trim naphthalene’s lead within phthalic anhydride market size metrics. Koppers’ withdrawal highlights the vulnerability of stand-alone tar processors, while China’s naphthalene imports dilute domestic cost advantages.
Integrated Asian complexes convert mixed xylene from catalytic reformers directly into ortho-xylene, lowering variable costs. CNPC reports reduced paraxylene imports to 19%, confirming rising local aromatics sufficiency that spills over into the phthalic anhydride market. Switching routes demands new fixed-bed oxidation reactors, posing a capital hurdle for legacy naphthalene plants.


By Application: Plasticizers Lead, but UPR Growth Reshapes Margins
Plasticizers absorbed 54.71% of the 2025 demand, anchoring commodity volumes in the phthalic anhydride market. Unsaturated polyester resins, however, chart the fastest 4.41% CAGR, signaling a higher-margin shift as offshore wind farms and marine laminates demand hydrolytic-stable matrices. Asia’s automotive wire harness growth still safeguards baseline plasticizer consumption, but European coatings are peeling away toward azelaic blends.
Developments in wind energy and marine composites elevate quality requirements, rewarding ISO-certified producers of low-chloride phthalic anhydride. By contrast, decorative coatings adopt bio-anhydrides, curbing traditional alkyd volumes. This divergence underscores how specialty niches rather than bulk plasticizers will define long-term profit pools within the phthalic anhydride market size.
By End-User Industry: Automotive Dominance Meets Electrical Growth
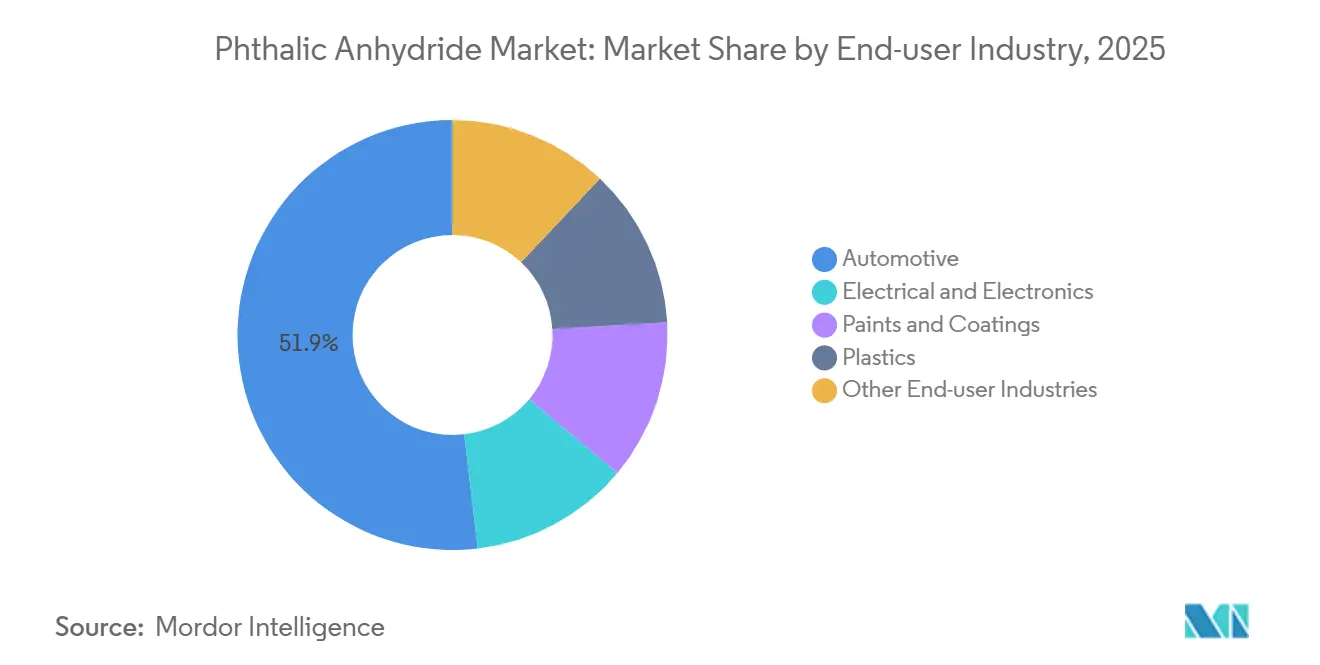
Automotive retained 51.88% of volume in 2025, reflecting entrenched use of flexible PVC and refinish alkyds. Yet, electrical and electronics is accelerating at 4.15% due to high-voltage EV cabling and battery additive uptake, a trend that lifts the phthalic anhydride market share for specialty dielectric plasticizers.
Paints, plastics, and agriculture fill the balance, with European coating reformulation trimming demand, while Asian construction keeps plasticized flooring on a solid path. Battery producers in China, Japan, and South Korea validate phthalate esters as SEI film formers, pointing to a nascent but strategic outlet that blends chemical purity with electrochemical performance.

Geography Analysis
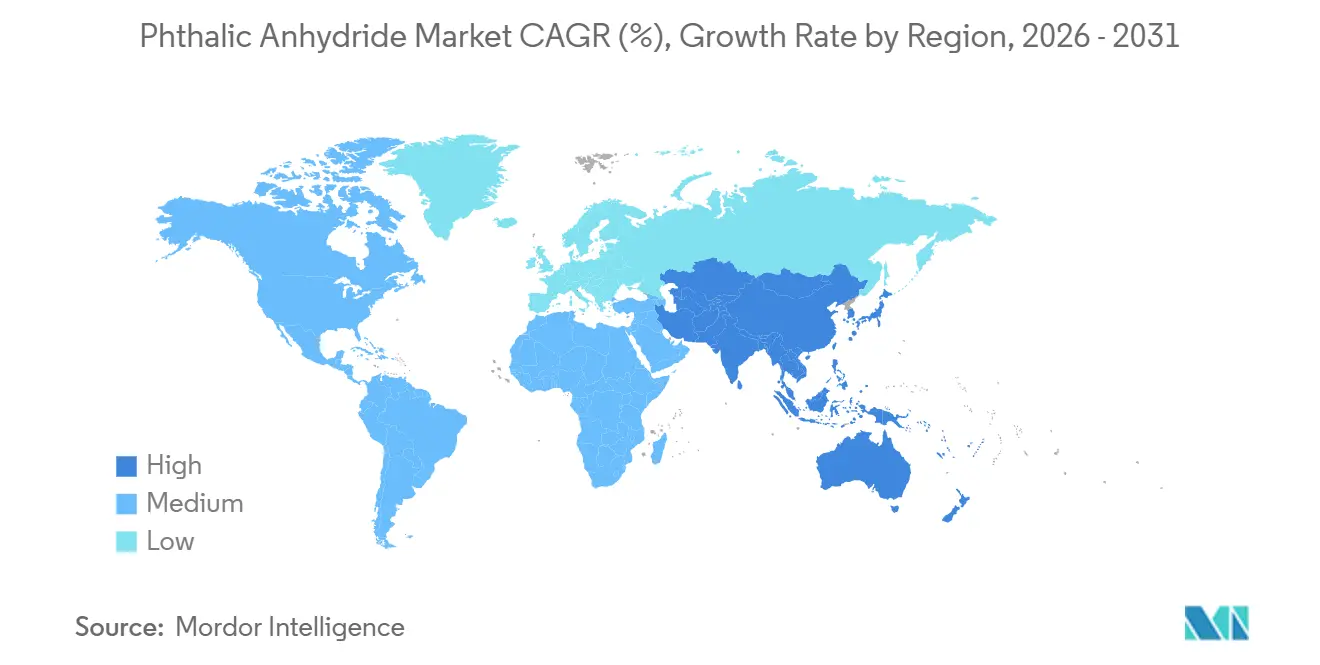
Asia-Pacific commanded 61.78% of the 2025 volume and is climbing at 3.22% through 2031. China alone hosts more than one-third of the capacity, and projects in Hebei (40,000 tons) plus Aekyung’s Ningbo expansion (50,000 tons) consolidate its lead even as domestic prices dropped 9.6% to RMB 5,967 t (USD 830.606 t) in 2025. India’s USD 37 billion capex plan raises native intermediates output, cutting 45% import dependence and cementing a two-company duopoly that already holds 70% of local supply.
North America faces shrinking coal-tar feed and now leans on imports after Koppers’ 2025 exit. Remaining integrated units cover niche demand, while Mexico channels finished PVC parts back into the US auto and electronics chains. Europe grapples with high energy costs and REACH limits; LANXESS safeguards regional output through proprietary catalysts but still reports EBITDA squeeze as Asian imports undercut prices.
South America and the Middle East & Africa remain comparatively small. Brazil’s recovery hinges on automotive output, and Saudi Arabia’s Vision 2030 could deepen local conversion beyond commodity aromatics. For now, both regions act mainly as export yards feeding Asia and Europe rather than drivers of fresh demand within the phthalic anhydride market.

Value Chain Analysis
The phthalic anhydride value chain begins with aromatics and coal-tar streams supplying ortho-xylene and naphthalene, along with utilities (air/oxygen via compressed air) and catalyst systems (commonly vanadium pentoxide) used in fixed-bed catalytic oxidation. The reaction is highly exothermic, so heat management media and plant-level control systems are central to day-to-day operations. Afterward, recovery and purification steps such as vacuum distillation are used to produce high-purity grades, and maleic anhydride can appear as a co-product or byproduct stream depending on plant configuration.
Midstream participants include integrated and merchant producers that balance feedstock sourcing with logistics and emissions compliance. I G Petrochemicals Limited operates an integrated multi-plant site at Taloja, Maharashtra, and Thirumalai Chemicals Limited (via TCL Specialties LLC in the United States) is positioned across the downstream specialty footprint. Downstream conversion routes phthalic anhydride into plasticizers (phthalate esters), unsaturated polyester resins, alkyd resins, and dyes/pigments. Kesar Petroproducts Limited is positioned in pigment derivatives and maintains EU REACH registrations for phthalocyanine pigments to support market access. Distribution typically includes bulk shipments to large resin and plasticizer manufacturers and packaged or flake supply for smaller formulators. Industry bodies such as the American Chemistry Council Phthalic Anhydride TSCA Risk Evaluation Consortium also shape compliance and influence supplier qualification and documentation requirements across the chain.
Competitive Landscape
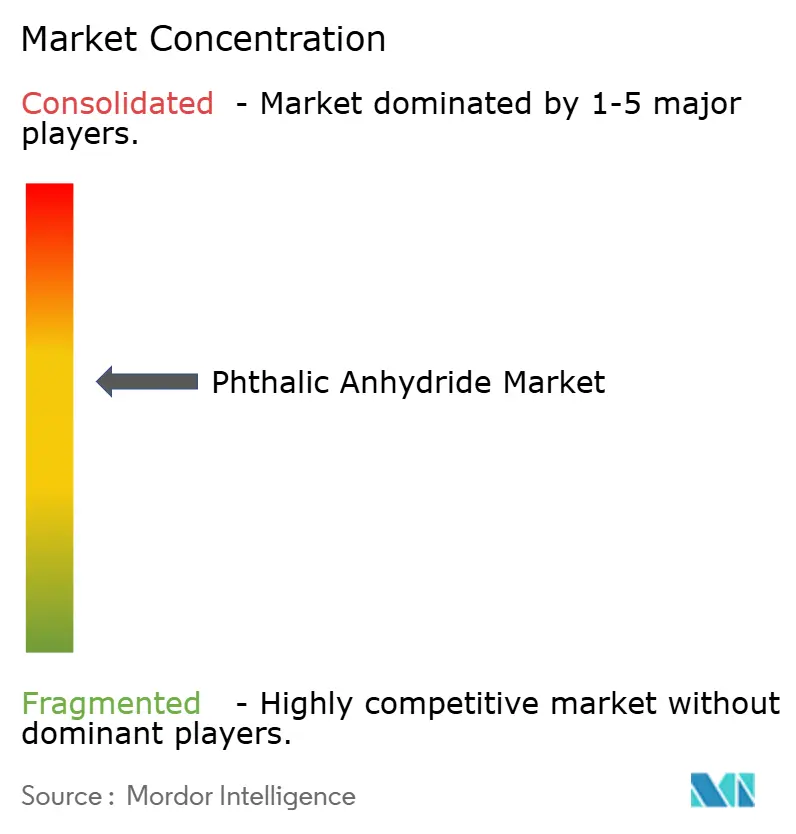
The Phthalic Anhydride Market is moderately concentrated. In China, more than 50 players operate under state or private oil-to-chemicals umbrellas, maintaining utilization discipline to balance inventories. LANXESS runs Europe’s main capacity across three sites, applying vanadium catalysts to boost selectivity, yet logged only USD 217 million EBITDA on USD 1.52 billion sales for the first nine months of 2024, underscoring squeezed spreads. Entrants face hurdles in catalyst know-how, chloride control, and multi-year product qualification, especially for wind and EV applications. As a result, the phthalic anhydride market balance will likely hinge on integrated Asian producers for volume and on Western specialists for niche purity grades, sustaining diverse strategies under one global umbrella.
Phthalic Anhydride Industry Leaders
BASF
IG Petrochemicals Ltd.
NAN YA PLASTICS CORPORATION
Polynt S.p.A.
NAN YA PLASTICS CORPORATION
- *Disclaimer: Major Players sorted in no particular order

Market Opportunities and Future Outlook
Supply security and regional trade positioning are being reshaped as producers and buyers react to feedstock volatility and import competition. In May 2026, India’s Directorate General of Trade Remedies recommended extending anti-dumping duties on phthalic anhydride imports from China and South Korea for another five years, which supports greater negotiating leverage for local producers and in-country tolling arrangements with downstream plasticizer and resin consumers. At the same time, the market continues to work through structural oversupply signals from Asia, with price weakness in China tied to ortho-xylene moves and downstream seasonality, which is pushing producers to differentiate through product consistency, qualification support, and tighter impurity control for higher-spec end uses.
Opportunities also concentrate around process and operating-model upgrades in regions outside the largest integrated oil-to-chemicals hubs. Modularization and efficiency improvements in fixed-bed catalytic oxidation lower barriers for mid-sized processors in India and parts of Southeast Asia, while compliance-driven capex (including EU REACH and US TSCA documentation and emissions controls) is steering purchasing toward suppliers that can sustain audited operations and provide detailed regulatory documentation. Demand-side opportunities are still linked to electrification and composites, where higher-purity grades carry through for plasticizer and UPR formulations and where customers seek reduced variability from non-integrated feedstock swings.
Recent Industry Developments
- May 2026: India's Directorate General of Trade Remedies recommended extending anti-dumping duties on phthalic anhydride imports from China and South Korea for another five years. The recommendation reinforces regional trade defenses against low-priced imports and supports operating visibility for domestic producers and local supply contracts.
- March 2026: BASF inaugurated its Verbund site in Zhanjiang, Guangdong Province, China, advancing a major integrated chemicals footprint in Asia. Expansion of world-scale integrated capacity strengthens regional aromatics and intermediates availability and adds competitive pressure on standalone Western and merchant-fed value chains.
- December 2024: Koppers Inc. announced plans to discontinue phthalic anhydride production at its Stickney, Illinois, site in 2025, taking USD 51-55 million in restructuring charges. The exit tightened North American domestic supply options and increased reliance on imports and alternative sourcing for downstream customers.


Research Methodology Framework and Report Scope
Market Definition and Coverage
This market is defined as the global demand and supply of phthalic anhydride, measured as material sold for downstream chemical use, and tracked across major producing and consuming regions in the same reporting year.
Scope exclusions: The sizing excludes downstream derivative revenues (such as plasticizers or resins), and it also excludes internal transfers that are not priced as external sales.
Segmentation Overview
- By Raw Material
- Ortho-xylene
- Naphthalene
- By Application
- Plasticizers
- Alkyd Resins
- Unsaturated Polyester Resins
- Other Applications (Dyes and Pigments, Insecticides, etc.)
- By End-user Industry
- Automotive
- Electrical and Electronics
- Paints and Coatings
- Plastics
- Other End-user Industries (Chemicals, Agriculture, etc.)
- By Geography
- Asia-Pacific
- China
- India
- Japan
- South Korea
- Rest of Asia-Pacific
- North America
- United States
- Canada
- Mexico
- Europe
- Germany
- United Kingdom
- France
- Italy
- Rest of Europe
- South America
- Brazil
- Argentina
- Rest of South America
- Middle-East and Africa
- Saudi Arabia
- South Africa
- Rest of Middle-East and Africa
- Asia-Pacific
Data Validation & Update Cycle
Validation is done in layers so that a single strong assumption does not dominate the output. The model is checked against independent signals such as capacity change timelines, unusual trade spikes, and region level demand narratives from interviews, and then variances are investigated before sign-off.
When the numbers move sharply, we re-contact sources to confirm whether the shift is due to a shutdown, a policy change, or a short term pricing and stocking pattern. Reports are refreshed annually, with interim updates when material events occur, and a final pre-delivery review is completed so clients receive the latest adjusted view.
Mordor Intelligence's Phthalic Anhydride Market Size Measured Against Other Published Estimates
Published market values for phthalic anhydride can look far apart because some authors size the market in USD, while others anchor the view in volume, and the conversion assumptions are not uniform. Differences also come from what gets counted as market activity, especially when internal transfers, merchant sales, and derivative value chains are blended together.
The table highlights that our current sizing is presented in million tons, while other sources often publish a USD value for a selected base year, which can shift depending on the price cycle, currency timing, and whether contract pricing or spot pricing is emphasized. It also depends on whether the study treats phthalic anhydride as a standalone chemical sale, or whether parts of downstream plasticizers and resins are being included in the same headline number.
Benchmark comparison
| Source | Market Size | Gaps in Research Methodology |
|---|---|---|
| Mordor Intelligence | USD 4.67 M (2025) | |
| Industry Publisher A | USD 4.64 B (2024) | This estimate is reported in USD and is highly sensitive to the chosen price deck and base year, and it can also reflect a different weighting of regional pricing and trade parity rather than a volume first reconciliation. |
| Industry Publisher B | USD 5.38 B (2025) | The number appears to rely on a USD revenue view that can move with currency conversion timing and assumed ASP progression, and it may apply broader application coverage without an explicit check on apparent consumption built from production and trade. |
The table shows a unit mismatch driving much of the spread, and in Mordor Intelligence's model the market is treated as physical phthalic anhydride volumes supplied to external demand, which are then cross-checked with production, utilization, and trade signals before any value view is inferred. With that discipline, users can trace the total back to a repeatable demand pool and understand what is included, instead of mixing adjacent downstream revenues into one headline.


Key Questions Answered in the Report
What is the forecast demand growth for phthalic anhydride through 2031?
Global consumption will rise from 4.79 million tons in 2026 to 5.41 million tons by 2031, reflecting a 2.48% CAGR driven mainly by Asia-Pacific wind-energy and EV applications.
Which raw material is gaining share within phthalic anhydride production?
Ortho-xylene is expanding at a 3.31% CAGR as integrated refineries in China, India, and the Middle East divert mixed xylene streams into oxidation units.
Why did Koppers exit the North American market?
The company shut its 100 000-ton Stickney plant in 2025 after shrinking coal-tar supply undermined naphthalene economics and triggered USD 51–55 million in write-downs.
How are bio-based alternatives affecting coatings demand?
European decorative paint makers have already replaced 8–10% of phthalic feedstock with azelaic or lignin-derived acids, trimming traditional alkyd volumes and slightly dampening overall market growth.
Which region dominates phthalic anhydride capacity?
Asia-Pacific accounts for 61.78% of global volume, led by China’s extensive oil-to-chemicals complexes and India’s ongoing capacity build-out.
Page last updated on:






