
Mining Chemicals Market Size and Share
Market Overview
| Study Period | 2021 - 2031 |
|---|---|
| Market Size (2026) | USD 7.32 Billion |
| Market Size (2031) | USD 9 Billion |
| Growth Rate (2026 - 2031) | 4.22% CAGR |
| Fastest Growing Market | Asia Pacific |
| Largest Market | Asia Pacific |
| Market Concentration | Medium |
Major Players *Disclaimer: Major Players sorted in no particular order Image © Mordor Intelligence. Reuse requires attribution under CC BY 4.0. | |
Mining Chemicals Market Analysis by Mordor Intelligence
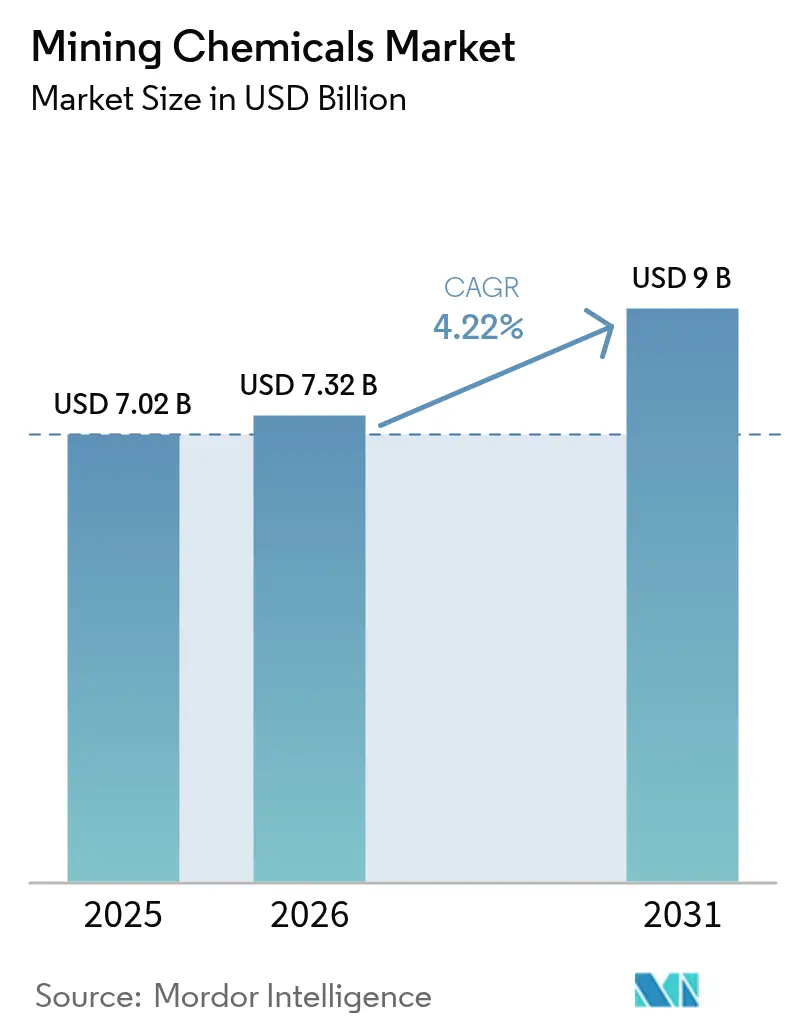
The mining chemicals market size is expected to increase from USD 7.02 billion in 2025 to USD 7.32 billion in 2026 and reach USD 9 billion by 2031, growing at a CAGR of 4.22% over 2026-2031. Flotation reagents remain the anchor of demand, yet direct-lithium-extraction (DLE) modules and solvent-extraction cascades for battery metals are redrawing global procurement maps. Sovereign manufacturing mandates in China, the United States, and the European Union are compelling mine operators to dual-source collectors and extractants, tempering the traditional dominance of center-led purchasing. Capital expenditure on nickel laterite, lithium spodumene, and porphyry-copper expansions is sustaining reagent volumes even as sensor-based ore sorting trims per-ton consumption. Meanwhile, accelerated tailings-management rules and water-recycling targets are channeling fresh spending toward high-molecular-weight flocculants that fit closed-loop circuits.
Key Report Takeaways
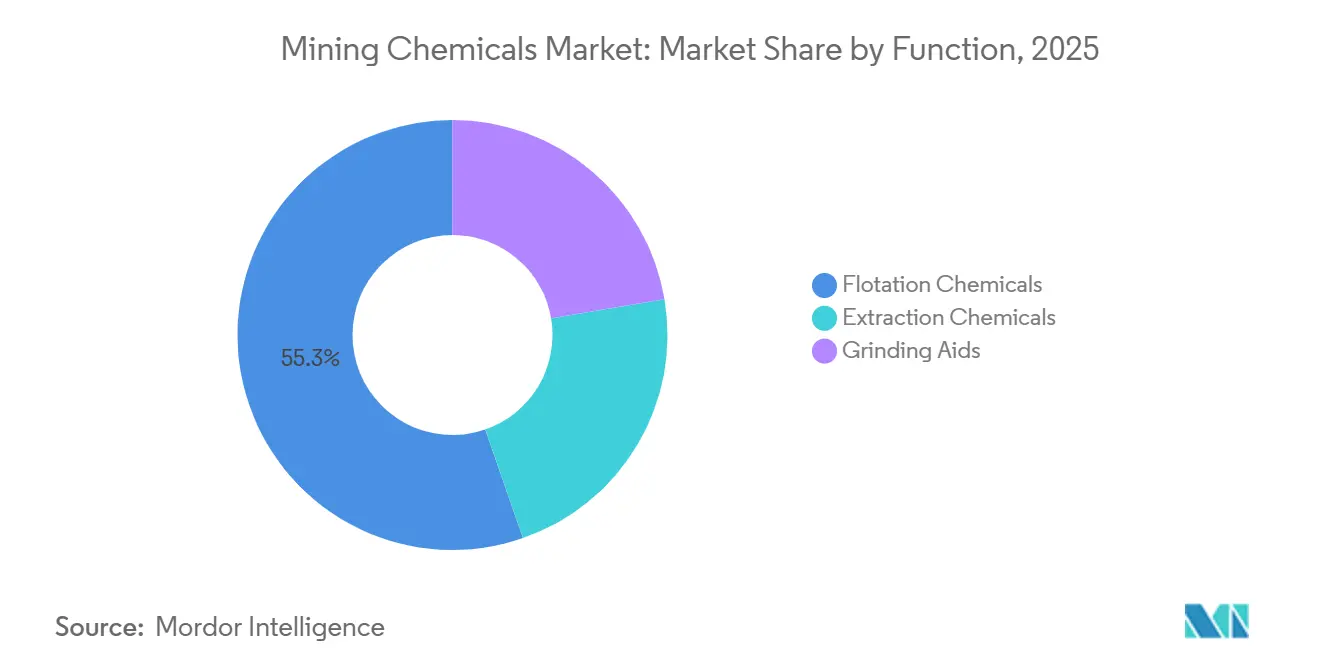
- By function, flotation chemicals held 55.33% of the mining chemicals market share in 2025. Extraction chemicals recorded the fastest expansion at a 4.33% CAGR through 2031.
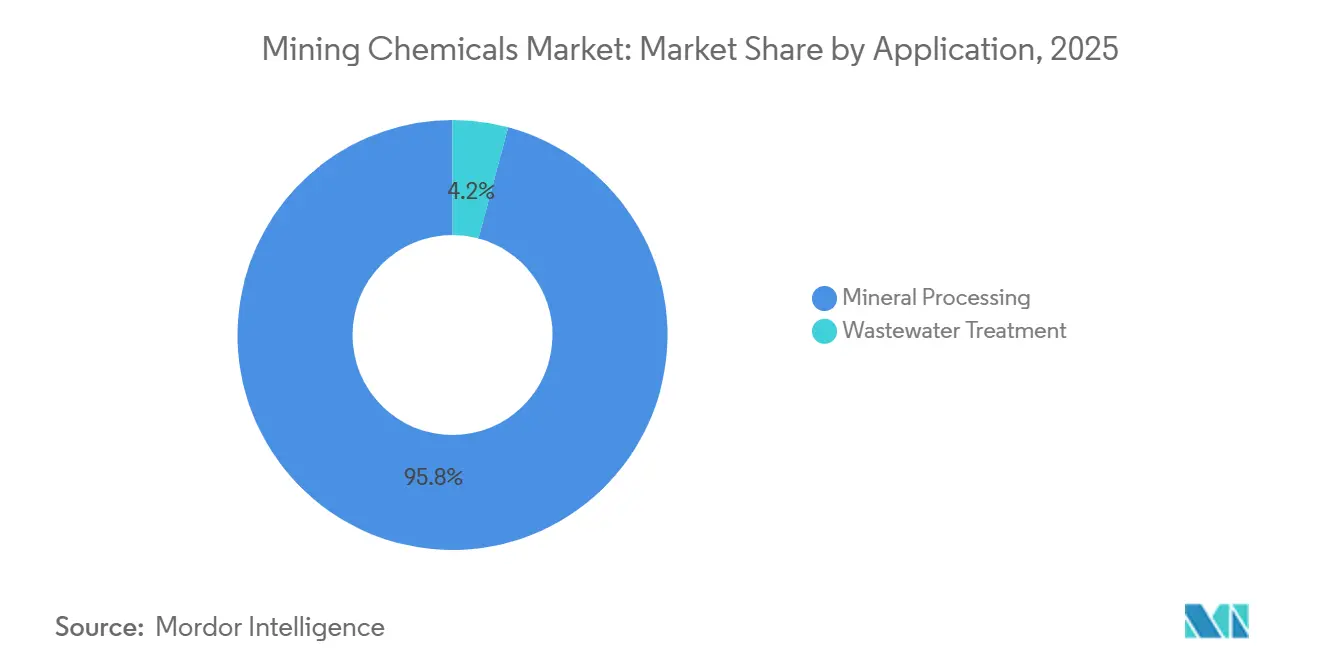
- By application, mineral processing accounted for 95.82% of the mining chemicals market size in 2025. Wastewater treatment posted the highest projected CAGR at 4.86% during 2026-2031.
- By region, Asia-Pacific led with 54.13% revenue share in 2025, while it is also set to grow at a 5.12% CAGR to 2031.
Note: Market size and forecast figures in this report are generated using Mordor Intelligence’s proprietary estimation framework, updated with the latest available data and insights as of 2026.
Global Mining Chemicals Market Trends and Insights
Drivers Impact Analysis*
| Drivers | (~) % Impact on CAGR Forecast | Geographic Relevance | Impact Timeline |
|---|---|---|---|
| Increasing Mining CAPEX in Asia-Pacific and North America | +1.2% | Asia-Pacific core (China, Indonesia, Australia), North America (Canada, United States) | Medium term (2-4 years) |
| Surging Mineral Demand from Electric Vehicle and Renewable-Energy Supply Chains | +1.5% | Global, with concentration in Asia-Pacific lithium/nickel processing and South American copper operations | Long term (≥ 4 years) |
| Stricter Water-Recycling Norms in Large Mines | +0.8% | Chile, Australia, South Africa, Peru—arid and water-stressed jurisdictions | Short term (≤ 2 years) |
| Commodity-Price Rebound Sustaining Exploration Budgets | +0.6% | Global, with emphasis on copper belts (Chile, Peru, Zambia) and gold districts (Canada, Australia) | Medium term (2-4 years) |
| Shift to Bio-Based Collectors for ESG Compliance | +0.4% | Europe, Canada, Scandinavia—jurisdictions with carbon-disclosure mandates | Long term (≥ 4 years) |
| Source: Mordor Intelligence | |||
Increasing Mining CAPEX in Asia-Pacific and North America
New nickel HPAL lines in Indonesia and lithium DLE pilots in Nevada and Alberta are lifting annual demand for sulfuric acid, tributyl phosphate, and crown-ether extractants. Copper expansions in Chile’s Atacama Desert and Canada’s Ring of Fire are adding collectors and frothers, although widespread ore-sorting retrofits are moderating reagent intensity.
Surging Mineral Demand from Electric Vehicle and Renewable-Energy Supply Chains
Through flotation or solvent extraction, battery metals are purified into intermediates. In China, lithium-iron-phosphate cells have surpassed cobalt-rich chemistries. Meanwhile, in Western Australia, spodumene flotation continues to use fatty-acid collectors. With projected copper deficits by 2030, the demand for xanthate and dithiophosphate collectors remains stable.
Stricter Water-Recycling Norms in Large Mines
Chile's DGA has mandated water recycling in new permits. This push is driving the installation of high-throughput thickeners, which are dosed with anionic polyacrylamide flocculants. In Australia and South Africa, similar regulations are accelerating the adoption of closed-loop circuits. These circuits can reduce freshwater intake. However, they also increase dissolved-salt loads, necessitating the use of specialty dispersants[1]Gobierno de Chile, “Reglamento de Recirculación de Agua en Minería,” mma.gob.cl .
Commodity-Price Rebound Sustaining Exploration Budgets
With copper prices hovering around a high level and gold surpassing a significant threshold, exploration expenditures for 2025 remained steady. In response to these market conditions, junior explorers increased their budgets, bolstering the demand for drilling fluids and pilot-scale flotation reagents, both of which are crucial for feasibility studies extending into 2027.
Restraints Impact Analysis*
| Restraints | (~) % Impact on CAGR Forecast | Geographic Relevance | Impact Timeline |
|---|---|---|---|
| Tightening Global Regulations on Toxic Reagents | -0.7% | Europe (REACH), North America (EPA Toxic Substances Control Act), China (MEE chemical inventory) | Medium term (2-4 years) |
| Volatile Crude-Derived Raw-Material Costs | -0.5% | Global, with acute impact on petrochemical hubs in Middle East, Asia-Pacific, and U.S. Gulf Coast | Short term (≤ 2 years) |
| Emerging Dry-Processing Technologies that Bypass Wet Reagents | -0.9% | Australia, Canada, South Africa—jurisdictions with high labor costs and water scarcity | Long term (≥ 4 years) |
| Source: Mordor Intelligence | |||
Tightening Global Regulations on Toxic Reagents
In 2024, ECHA added sodium ethyl xanthate to the REACH Candidate List, setting off an authorization sunset for 2026. Meanwhile, the U.S. EPA is scrutinizing potassium amyl xanthate, and China's MEE is now requiring fresh toxicity dossiers for 47 flotation reagents. These compliance costs are siphoning off research and development budgets, potentially hindering the adoption of new collectors, especially in jurisdictions that are cautious[2]European Chemicals Agency, “Candidate List of Substances of Very High Concern,” echa.europa.eu.
Volatile Crude-Derived Raw-Material Costs
Brent crude's fluctuations have driven up costs for carbon disulfide and alcohol, leading to a rise in xanthate prices. Meanwhile, contract outages at Gulf Coast crackers have tightened the supply of ethylene and propylene. In response, mines are extending their inventory cycles and exploring toll-blending options as a hedge against feedstock risks.
*Our forecasts treat driver/restraint impacts as directional, not additive. The impact forecasts reflect baseline growth, mix effects, and variable interactions.
Segment Analysis
By Function: Extraction Chemicals Advance on DLE Momentum
In 2025, flotation chemicals are projected to account for 55.33% of the mining chemicals market revenue. While collectors, frothers, and depressants lead in value, there's a notable rise in the adoption of hydroxamate and bio-based collectors, especially in oxide-copper and nickel laterite circuits. Extraction chemicals, representing diluents and organophosphorus extractants, are riding the direct-lithium-extraction wave at a 4.33% CAGR, underscoring a subtle shift in the mining chemicals market size allocation across functional lines. DLE initiatives in Arkansas and Bolivia, showcasing substantial water savings and expedited cycle times, are driving up the demand for crown-ether and phosphate-based extractants. Concurrently, rare-earth facilities in China and the U.S. are now utilizing significant volumes of C6-C12 diluents to maintain stable mixer-settler temperature profiles.
Grinding aids, though the smallest segment in the mining chemicals arena, are witnessing promising trials. In Chilean copper and Mongolian gold concentrators, these aids have led to notable increases in throughput and reductions in energy consumption. However, broader adoption is contingent on demonstrating a return on investment, especially with varying ore hardness. In a related trend, suppliers are now offering digital dosage valves alongside reagents. This strategy not only curbs overdosing but also resonates with the industry's pivot towards performance-centric purchasing.



By Application: Wastewater Treatment Gains Regulatory Tailwind
Mineral processing captured 95.82% of 2025 application revenue, cementing its role as the prime consumer segment within the mining chemicals market. Large sulfide concentrators produce process water for every metric ton of ore. With closed-loop mandates in play, operators are now channeling investments into thickeners and high-charge-density polyacrylamides, aiming to reduce turbidity levels. This trend solidifies mineral processing's pivotal role in the mining chemicals market, a position expected to endure through 2031.
While wastewater treatment represented a modest portion of the 2025 market, is expanding at a 4.86% CAGR. Projects addressing acid mine drainage in legacy coal basins, alongside tailings dam upgrades in South America, are utilizing lime, coagulants, and flocculants in their staged neutralization processes. Moreover, instrumented polymer make-up systems are being employed to fine-tune viscosity and dosage, a trend that leans towards suppliers offering both chemical and digital solutions. Given this growth disparity, a gradual market rebalancing seems imminent, especially as ESG-linked financial pressures compel mines to be transparent about their water intensity metrics.
Geography Analysis
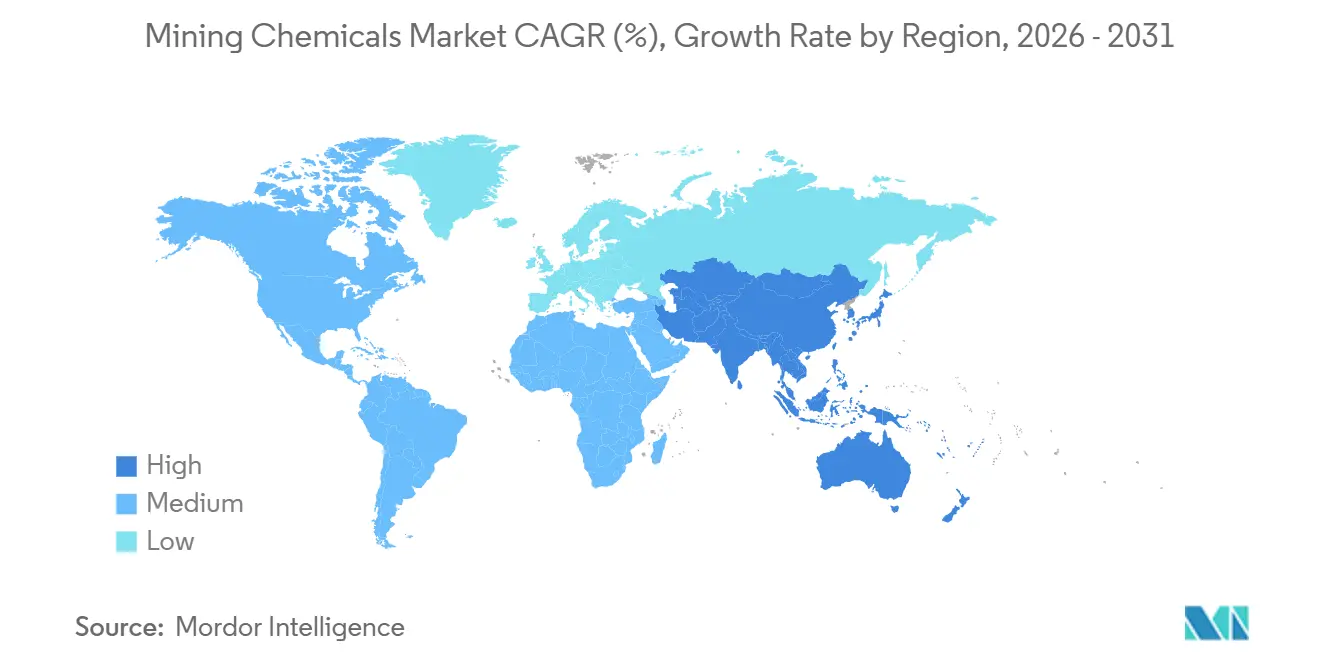
Asia-Pacific dominated the mining chemicals market with 54.13% of 2025 revenue and is advancing at a 5.12% CAGR to 2031. Indonesia has rolled out new HPAL lines, each with significant annual consumption of sulfuric acid and extractants. In Jiangxi and Inner Mongolia, China has boosted its copper-ore processing capacity, utilizing domestically produced xanthates that are priced lower than their imported counterparts. Australia has ramped up its lithium hydroxide output, with spodumene flotation increasingly relying on fatty-acid collectors due to finer ore feeds. Meanwhile, Japan and South Korea have positioned themselves as key blending hubs, importing pine-oil frothers and redistributing them to nickel smelters in Indonesia.
North America accounted for a notable portion of the market's 2025 revenue. In Nevada’s Clayton Valley and Alberta’s Leduc Formation, pilot projects are testing DLE columns, which require specialty ion-exchange resins and tributyl phosphate diluents. Expansions in copper production in Arizona and British Columbia, along with potash debottlenecking in Saskatchewan, are driving sustained demand for collectors. While Mexico’s silver and gold belts continue to be consistent consumers, community pushback has postponed cyanide-based projects, leading to a dip in short-term reagent orders.
Europe, South America, and the combined regions of the Middle East and Africa account for the remaining share of the mining chemicals market. In 2025, Chile and Peru made joint purchases of xanthates and dithiophosphates. However, due to escalating water scarcity issues, there's a swift shift towards high-throughput thickeners treated with anionic polyacrylamide. Operators in South Africa’s Bushveld region are now opting for intricate depressant blends to adeptly handle both Merensky and UG2 mineralogy. Furthermore, Scandinavian mines are testing bio-collectors, which hold the potential to set global standards, especially with impending REACH restrictions tightening post-2026.

Regulatory Landscape
Mining chemicals suppliers and mine operators face tighter hazard and emissions compliance across major jurisdictions. Chemical management frameworks including EU REACH/CLP, US TSCA, and China MEE chemical inventory requirements increasingly influence which collectors, frothers, extractants, and flocculants can be specified in permits and procurement. In Europe, ECHA added sodium ethyl xanthate to the REACH Candidate List in 2024, which drove authorization planning around a 2026 sunset and accelerated substitution work on lower-toxicity and bio-based collectors where feasible.
Water and tailings-related permitting is also pulling more chemistry into regulated operating envelopes. In the United States, EPA actions under TSCA, including May 2026 significant new use rules for certain chemical substances, and facility-level water permitting activity, such as the July 2026 draft NPDES permit process for Chevron Mining Inc. Questa Mine, increase the need for documentation, monitoring, and reporting. Canada continues to update the Metal and Diamond Mining Effluent Regulations via project-specific amendments that designate tailings impoundment areas (registered in 2025), while Ontario and the US Department of the Interior advanced 2025 measures (Ontario Regulation 463/24 and DOI Secretarys Order No. 3436). These updates focused on streamlining recovery of critical minerals from tailings and mine waste, expanding the compliance perimeter for processing chemicals used in such recovery flowsheets.
Value Chain Analysis
The mining chemicals value chain begins with upstream feedstocks, including petrochemical intermediates for xanthates and organophosphorus extractants, along with bio-based or renewable inputs such as guar, cellulose, and starch for select flocculants and additives. Suppliers then move through synthesis, formulation, and on-site application support. Global players such as Syensqo, BASF, Clariant, Nouryon, and SNF Group operate through a mix of integrated production and regional blending and technical centers near mining hubs to manage logistics constraints and tailor reagent packages to ore mineralogy and water chemistry, especially for flotation and solid-liquid separation circuits.
Midstream, performance validation and dosing optimization are increasingly bundled with chemicals as mines deploy instrumentation and automated make-up and dosing skids to control consumption and stabilize recovery in variable ore feeds. Downstream distribution often combines direct-to-mine contracts for high-volume reagents, including collectors, frothers, flocculants, sulfuric acid, and diluents used in hydrometallurgy, with local distributors for specialty additives and faster response to plant upsets. Bottlenecks are most visible in critical-metals processing, where separation capacity is geographically concentrated, reinforcing procurement strategies that regionalize supply and, where possible, integrate recycling and local processing partnerships (including Solvays staged investments and partnerships in rare earth recycling, as disclosed in its 2025 integrated reporting and updated in 2026 investor-facing materials).
Competitive Landscape
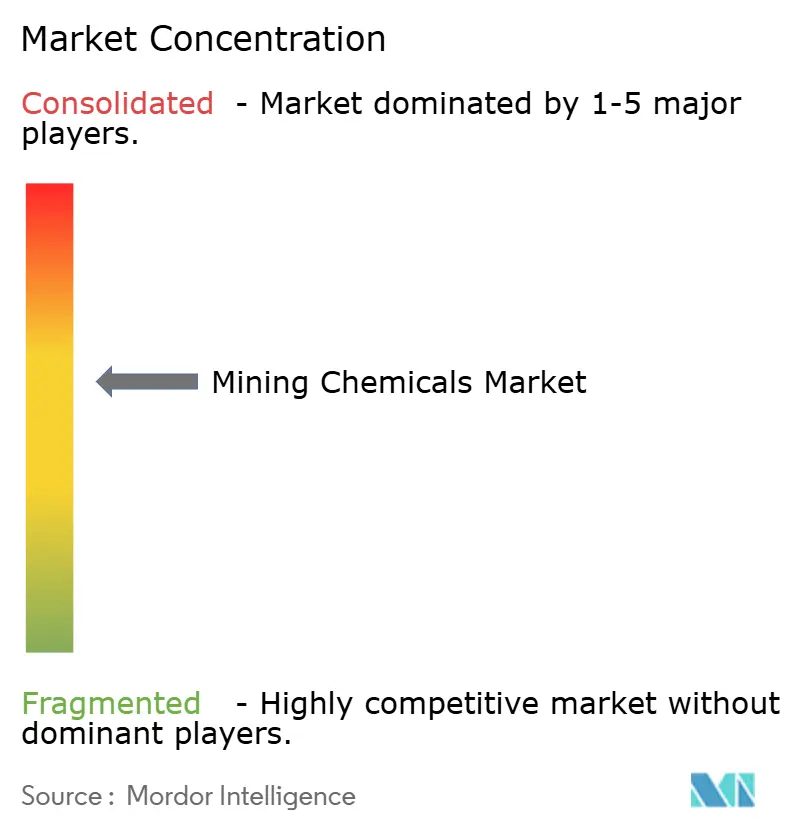
The mining chemicals market remains moderately consolidated. SNF Group maintains a dominant position in high-molecular-weight flocculants through backward integration into acrylamide monomer. White-space opportunities revolve around DLE extractants expected to create a niche by 2030 if the technology captures a significant share of global lithium output. Digital dosing platforms from Ecolab’s Nalco Water integrate flowmeters and AI-driven set-point control, reducing polymer overdosing and differentiating on total-cost-of-ownership rather than reagent price alone. Patent filings covering bio-collectors and lithium-selective extractants surged between 2023 and 2025, underscoring the innovation race that will shape competitive dynamics through the forecast period.
Mining Chemicals Industry Leaders
Syensqo
BASF
Clariant
Nouryon
Orica Limited
- *Disclaimer: Major Players sorted in no particular order

Market Opportunities and Future Outlook
Substitution and reformulation programs are creating near-term whitespace in collectors and gold-related process chemistries as regulators and customers tighten scrutiny on toxic reagents. The 2024 REACH Candidate List inclusion of sodium ethyl xanthate, with authorization planning tied to a 2026 timeline, is pushing suppliers toward alternative collector chemistries and bio-based options in jurisdictions where carbon disclosure and hazard profiling function as procurement gates. A parallel opportunity also sits in cyanide-reduction pathways for precious metals processing, supported by field-trial evidence such as American Industrial Chemicals Inc reporting a July 2026 live trial result for its TAS96 cyanide-replacement flotation reagent, including a measured recovery uplift versus a cyanide-based benchmark.
Supply security for hydrometallurgy inputs is another actionable area, particularly where new acid capacity and sulfur derivatives expand sourcing options for leaching, pH control, and solvent extraction circuits. EuroChem starting up an 800,000 tpy sulfuric acid plant in Kazakhstans Zhambyl Region in June 2026 and Coromandel Internationals trial production at new acid plants in Kakinada in March 2026 point to investment in upstream acid infrastructure that can change delivered cost and availability for mines and processing hubs. Portfolio moves that widen access to sulfur dioxide and sulfur derivatives also expand addressable applications in mining and water treatment, including Ecovyst completing a USD 190 million acquisition of Ineos Enterprises Calabrian sulfur business in July 2026.
Recent Industry Developments
- May 2026: Syensqo launched a strategic review of its Performance and Care segment, which includes its specialty mining reagents portfolio, as part of a broader shift toward becoming a pure-play specialty materials company. The move signals potential changes in asset focus and capital allocation for mining reagent R&D and commercialization, influencing long-term supplier positioning for flotation and solvent extraction chemistries.
- June 2025: BASF signed a cooperation agreement with FUCHS in Australia, making FUCHS the exclusive market interface for BASFs flotation and dewatering solutions portfolio (including Lupromin, Luprofroth, Luproset, and Drimax). The arrangement strengthens local coverage and technical responsiveness in a major mining region, and it reflects a go-to-market shift toward partner-led distribution for reagent packages.
- November 2024: Solenis acquired BASFs global flocculant mining business, including key mining trademarks such as Magnafloc, Rheomax, and Alclar, expanding its position in solid-liquid separation. The deal reshaped competitive dynamics in polymer flocculants while allowing BASF to concentrate more heavily on flotation reagents, leaching, and solvent extraction technologies.


Research Methodology Framework and Report Scope
Market Definition and Coverage
For this study, the mining chemicals market covers revenue from process chemicals and reagents used to separate, extract, and treat minerals and ores across mining and mineral processing operations.
Scope exclusions: It excludes bulk industrial commodities not primarily sold for mining use (such as general-purpose acids, fuels, and explosives) when they are not supplied as mining-specific chemical solutions.
Segmentation Overview
- By Function
- Flotation Chemicals
- Collectors
- Depressants
- Flocculants
- Frothers
- Dispersants
- Extraction Chemicals
- Diluents
- Extractants
- Grinding Aids
- Flotation Chemicals
- By Application
- Mineral Processing
- Wastewater Treatment
- By Geography
- Asia-Pacific
- China
- India
- Japan
- South Korea
- Indonesia
- Malaysia
- Australia and New Zealand
- Rest of Asia-Pacific
- North America
- United States
- Canada
- Mexico
- Europe
- Germany
- United Kingdom
- France
- Italy
- Russia
- Rest of Europe
- South America
- Brazil
- Argentina
- Rest of South America
- Middle-East and Africa
- Saudi Arabia
- South Africa
- Rest of Middle-East and Africa
- Asia-Pacific
Data Validation & Update Cycle
Outputs were validated through triangulation across independent signals, including mining production series, trade movement patterns for relevant chemical categories, and cross-checks against publicly visible capacity or expansion announcements. Variances were reviewed in steps, first at the region and application level, and then at the total market level, before internal sign-off.
The report is refreshed annually, and interim updates are triggered when material events occur, such as large mine restarts, sharp commodity swings, or major regulatory changes that shift treatment requirements. Before delivery, a final review pass is completed so clients receive the most current view aligned to the latest available data and expert feedback.
Mordor Intelligence's Mining Chemicals Market Size Compared With Other Published Estimates
Published market values for mining chemicals can look far apart, even when the topic name is the same, because the scope boundary and the activity driver behind demand are not handled the same way. Different groups also pick different base years and exchange-rate timing, which can move the reported USD number without any real change in mine-site consumption.
Mine production throughput, reagent function mix, and treatment intensity are the evidence points that keep Mordor Intelligence's estimate tied to chemicals directly used in mineral processing and mine-water handling, rather than being inflated by broader industrial chemical spending near mining. Differences also show up when some estimates bundle explosives, fuels, or generalized acids, or when pricing is projected using aggressive commodity up-cycles without being checked against procurement feedback.
Benchmark comparison
| Source | Market Size | Gaps in Research Methodology |
|---|---|---|
| Mordor Intelligence | USD 7.32 B (2026) | |
| Industry Publisher A | USD 11.80 B (2024) | Uses an earlier base year and a wider product boundary that appears to include broader mining-related chemical categories beyond process reagents, which lifts the value pool versus a function-led definition. |
| Consultancy B | USD 10.36 B (2024) | Likely applies a broader global revenue scope and a different ASP progression approach across chemical types, and the conversion to USD can differ based on currency timing and inflation treatment. |
Taken together, the spread is mainly explained by how tightly the market is tied to processed ore activity and which chemical buckets are counted as in-scope. By keeping assumptions traceable to throughput-linked demand indicators and then confirming price and usage ranges through interviews, the estimate stays practical to replicate and easier to audit.


Key Questions Answered in the Report
What CAGR is forecast for the mining chemicals market between 2026 and 2031?
The sector is projected to advance at a 4.22% CAGR from USD 7.32 billion in 2026 to USD 9.00 billion.
Which region leads global demand for mining reagents?
Asia-Pacific contributed 54.13% of 2025 revenue and is growing faster than the worldwide average at a 5.12% CAGR to 2031.
Why are extraction chemicals gaining momentum relative to flotation reagents?
Direct-lithium-extraction modules and rare-earth solvent-extraction circuits are expanding, lifting demand for organophosphorus extractants at a forecast 4.33% CAGR.
How are water-recycling mandates shaping reagent consumption?
New rules in Chile, Australia, and South Africa require 80% or higher water recycling, boosting flocculant volumes for closed-loop circuits.
Page last updated on:






