
Maize Market Analysis by Mordor Intelligence
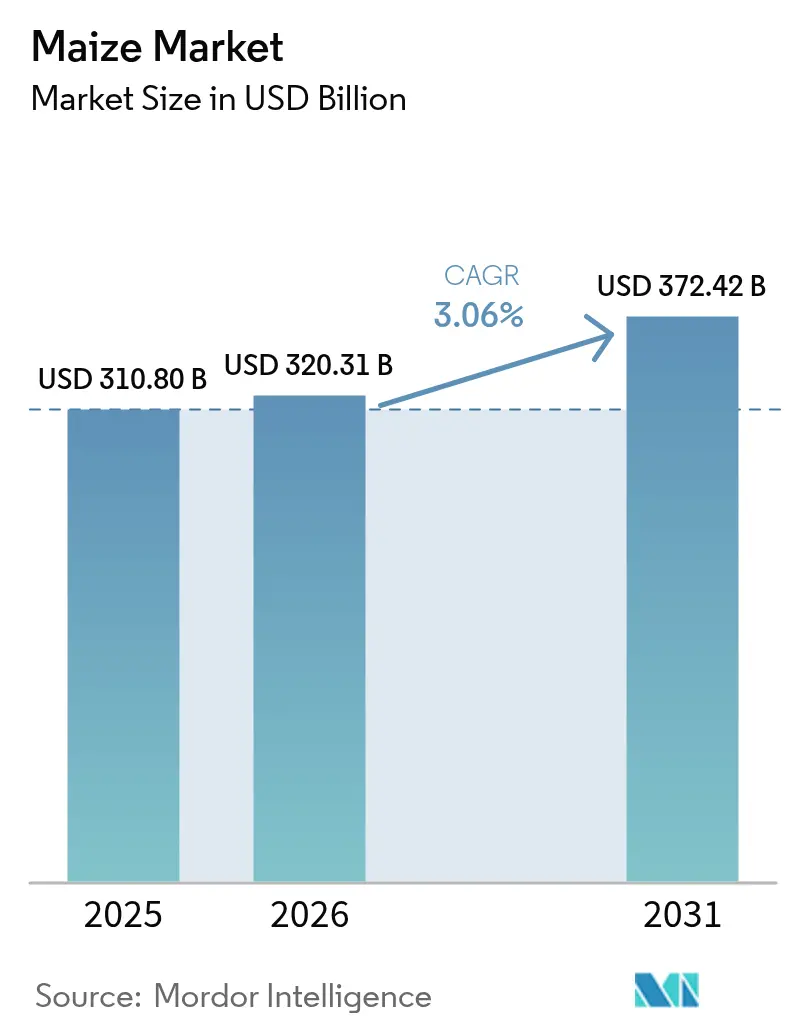
Maize market size in 2026 is estimated at USD 320.31 billion, growing from 2025 value of USD 310.80 billion with 2031 projections showing USD 372.42 billion, growing at 3.06% CAGR over 2026-2031. Sustained demand from animal feed, biofuel blending mandates, and starch-based industrial applications underpins this momentum, even as climate volatility and trade frictions introduce short-term price swings. Structural tailwinds include the worldwide shift toward higher-protein diets, rapid innovation in high-yield hybrids, and an accelerating build-out of on-farm grain storage that improves marketing flexibility. Competitive intensity is rising as leading traders streamline portfolios and seed companies commercialize short-stature hybrids that support denser plantings and mechanized harvesting. Meanwhile, policy resolutions such as the February 2025 lifting of Mexico’s biotech import ban underscore the pivotal role of trade frameworks in safeguarding uninterrupted grain flows.
Key Report Takeaways
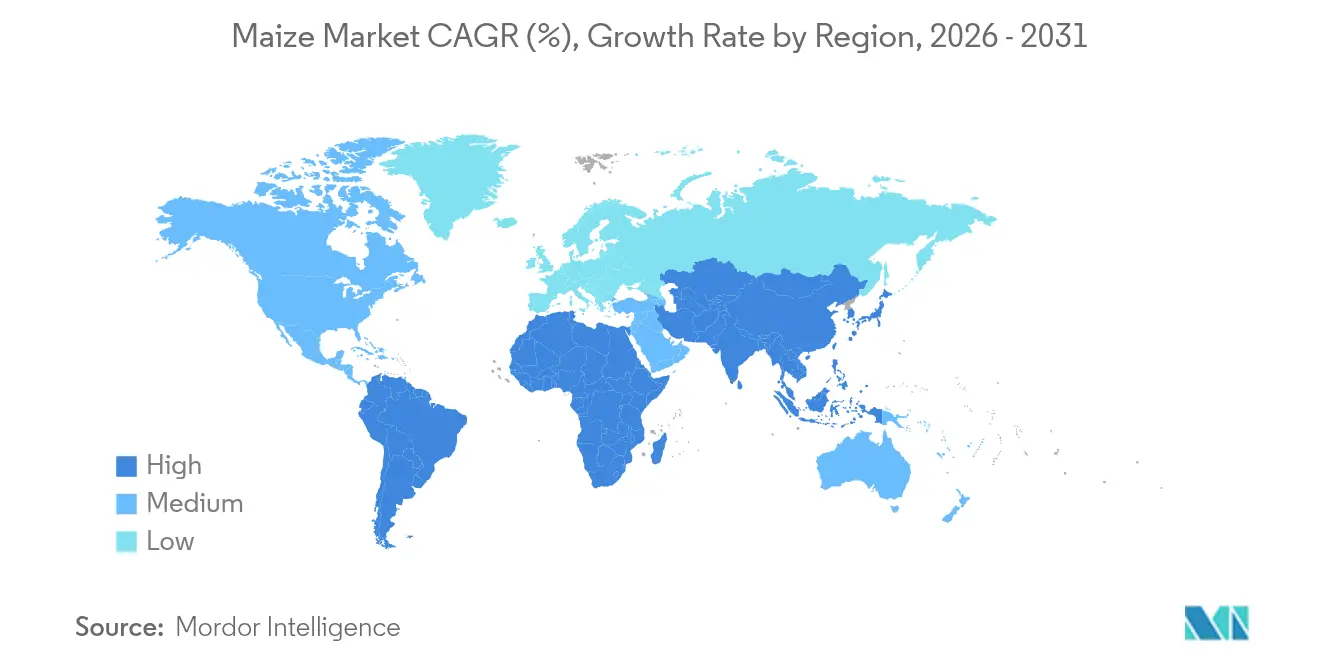
- North America commanded 35.05% of the maize market share in 2025. Asia-Pacific is projected to record the fastest regional growth at a 4.96% CAGR through 2031.
Note: Market size and forecast figures in this report are generated using Mordor Intelligence’s proprietary estimation framework, updated with the latest available data and insights as of 2026.
Global Maize Market Trends and Insights
Drivers Impact Analysis*
| Driver | (~) % Impact on CAGR Forecast | Geographic Relevance | Impact Timeline |
|---|---|---|---|
| Rising demand for animal feed | +1.2% | Asia-Pacific and South America | Medium term (2-4 years) |
| Growing biofuel blending mandates | +0.8% | North America, Brazil, India, Southeast Asia | Long term (≥ 4 years) |
| Technological advancements in high-yield GM hybrids | +0.6% | Global | Long term (≥ 4 years) |
| Favorable trade policies and tariff reductions | +0.4% | Major export corridors | Short term (≤ 2 years) |
| Rapid build-out of high-capacity grain storage infrastructure | +0.3% | Asia-Pacific and Africa | Medium term (2-4 years) |
| Booming demand for corn-based sweeteners and starches | +0.2% | Global | Medium term (2-4 years) |
| Source: Mordor Intelligence | |||
Rising Demand for Animal Feed
Animal protein consumption is climbing sharply in emerging economies, and livestock rations rely on maize as the primary energy ingredient. Brazil domestic corn use jumped 53% over the past decade as meat packers scaled production, drawing 2.539 billion bushels in 2024-2025 alone. Asia’s aquaculture operators are also turning to maize-based gluten meals that lower formulation costs and improve pellet stability. These parallel demand streams lift the maize market’s baseline and cushion it from cyclical softness in any single end use. As urbanization and income gains continue, the maize market will capture further upside from protein-centric dietary transitions.
Growing Biofuel Blending Mandates
Mandatory blending targets anchor a sizable share of annual corn offtake, creating relatively inelastic demand in the maize market. The United States keeps ethanol production near 1.05 million barrels per day, translating to 5.5 billion bushels of corn each marketing year under the Renewable Fuel Standard. Emerging sustainable aviation fuel pathways promise additional structural demand as producers pursue Inflation Reduction Act credits through carbon-intensity reductions. Blending mandates therefore insulate portions of the maize market from short-term price gyrations while catalyzing investment in processing capacity.
Favorable Trade Policies and Tariff Reductions
February 2025’s United States-Mexico-Canada Agreement (USMCA) ruling prompted Mexico to lift its biotech corn import ban, preserving a USD 5.6 billion bilateral trade lane and easing uncertainty in the maize market. Elsewhere, tariff liberalization on select routes has lowered landed costs for feed millers, encouraging geographically diversified sourcing. Yet potential United States tariff escalations and European Union duties on U.S. maize highlight how policy shifts can quickly reconfigure global flows. Successful traders increasingly hedge through multi-origin procurement strategies and contractual flexibility. The net result is a maize market that rewards agility and real-time policy monitoring.
Rapid Build-Out of High-Capacity Grain Storage Infrastructure
Additional storage gives farmers the option to delay sales until pricing is favorable, smoothing seasonal gluts and supporting the maize market. India is investing in modernizing its grain storage infrastructure to address post-harvest losses, which currently account for 25% of annual production. The infrastructure upgrade encompasses steel silos, smart warehouses, and mobile storage units for wheat, rice, and maize. North African and Middle-Eastern governments likewise invest in silos that reduce reliance on volatile spot imports. Expanded storage infrastructure not only curbs post-harvest losses but also encourages growers to scale planted acreage, reinforcing the maize market’s expansion loop.
Restraints Impact Analysis*
| Restraint | (~) % Impact on CAGR Forecast | Geographic Relevance | Impact Timeline |
|---|---|---|---|
| Climate change-driven yield volatility | −0.9% | Sub-Saharan Africa and Central America | Long term (≥ 4 years) |
| Escalating fertilizer and agro-input prices | −0.6% | Global (highest pressure on developing economies) | Medium term (2-4 years) |
| Geopolitical export restrictions and quotas | −0.4% | Major exporters such as Argentina and India | Short term (≤ 2 years) |
| Mycotoxin contamination tightening safety rules | −0.3% | European Union and other strict markets | Medium term (2-4 years) |
| Source: Mordor Intelligence | |||
Climate Change-Driven Yield Volatility
Heat waves and erratic precipitation already disrupt planting and pollination windows, pushing yield variability higher in the maize market. Research indicates each 1°C temperature rise can shave 7.4% off global maize yields, while modeling shows the probability of crop-insurance claims in the United States Corn Belt could double by mid-century. Sub-Saharan countries face even steeper risks. Burkina Faso could see 40% yield losses in core growing zones under high-emission scenarios. Producers are adopting climate-smart hybrids and shifting acreage, yet extreme weather brings added costs for irrigation, crop insurance, and replanting. This volatility dampens long-term capital planning and tempers the maize market’s growth trajectory.
Mycotoxin Contamination Tightening Safety Rules
Stricter global limits on aflatoxin and related mycotoxins elevate compliance costs for exporters. The European Union’s Regulation 2023/915 sets maximum levels of 100 micrograms per kilogram for unprocessed maize, effective July 2024. The United States Food and Drug Administration now mandates accredited laboratory testing for imported lots, adding time and expense.[1]U.S. FDA, “Laboratory Accreditation for Mycotoxins,” fda.gov FAO data suggest up to one-quarter of grain output suffers contamination episodes, forcing traders to install advanced monitoring and sorting technologies. For smaller growers, testing fees can be prohibitive, effectively narrowing market access and placing downward pressure on the maize market’s exportable surplus.
*Our forecasts treat driver/restraint impacts as directional, not additive. The impact forecasts reflect baseline growth, mix effects, and variable interactions.
Geography Analysis
North America retained a commanding 35.05% maize market share in 2025. The region’s productivity edge derives from widespread precision-agriculture adoption, genetically advanced hybrids, and well-capitalized farm structures. The maize market benefits from coordinated logistics that move grain efficiently from Midwest farms to Gulf loading terminals, while policy stability around ethanol blending provides a predictable demand floor.
South America offers a contrasting picture of rapid acreage expansion coupled with infrastructure catch-up. Brazil is commissioning new corn-ethanol plants and twin-track rail lines that shorten travel times from Mato Grosso to Atlantic ports, thereby boosting farmer gate prices and reinforcing the region’s competitiveness in the maize market. Brazil’s domestic corn consumption climbed 53% in the past decade, supported by surging meat and ethanol sectors that collectively underpin South America’s growing influence. Asia-Pacific is projected to record the fastest regional growth at a 4.96% CAGR through 2031. Asia-Pacific’s consumption outpaces local production in several populous economies, necessitating large import programs and heightened exposure to freight and basis swings. Governments respond through strategic stockpiling and targeted support for domestic hybrid seed industries. India’s decision to raise corn-based ethanol procurement prices by 29% is accelerating local usage and incentivizing acreage gains. Meanwhile, storage investments across North Africa and the Middle East mitigate import-timing risks and stabilize domestic milling margins. Africa, though still a net importer, is narrowing its shortfall via yield-boosting initiatives and better post-harvest infrastructure. Europe remains supply-constrained by environmental regulations, but expanded feed-grade corn imports help bridge protein demand, underscoring the interconnected nature of the maize market.


Regulatory Landscape
Maize trade and processing are governed by overlapping sanitary and phytosanitary (SPS) rules, biotech approvals, and end-use mandates (notably fuel blending), which shape cross-border flows and compliance costs. In the European Union, imported maize and maize-based feed and food products are subject to official controls and risk-based border checks, and the bloc has tightened contaminant compliance through Regulation (EU) 2023/915, which set maximum levels for certain contaminants in food, including specific limits for unprocessed maize effective July 2024.
Trade policy and import-control updates continue to affect routing choices and exporter documentation requirements. For North American flows, a February 2025 USMCA-linked decision led Mexico to lift its biotech corn import ban, reducing uncertainty for a major bilateral corridor. In the EU, implementing acts and periodic updates to import control lists also reinforce the need for continuous monitoring of commodity classifications, sampling frequency, and lab-testing expectations for mycotoxins and other residues in maize shipments.
Value Chain Analysis
The maize value chain starts with upstream inputs such as hybrid and GM seed, fertilizers, crop protection, farm machinery, and precision tools, and then moves through on-farm production, aggregation, storage, and primary trade origination. Midstream activities include drying, grading, and quality assurance, including mycotoxin testing, followed by logistics via truck, rail, barge, and ocean freight into export channels or domestic processing.
Downstream demand is led by animal feed compounders and integrated livestock producers, alongside industrial users such as wet millers (starch, sweeteners, ethanol, and co-products) and dry millers. Global physical trade is concentrated among a small set of export origins, with the United States, Brazil, Argentina, and Ukraine forming the main backbone of export availability, which increases the impact of corridor disruptions and policy shifts on price discovery and basis. Operational bottlenecks cited across supply chains include port and inland logistics constraints in Brazil, geopolitical instability affecting Ukrainian land and river corridors, and climate-linked irrigation stress in parts of Mexico. Recent production signals also flow through the chain, for example, USDA NASS estimated U.S. corn planted area at 95.3 million acres in June 2026 (down 3% from 2025), affecting elevator throughput planning, rail allocations, and procurement strategies for processors and exporters.
Market Opportunities and Future Outlook
Opportunities in the maize market are increasingly tied to (1) compliance-ready trade into strict import regimes, (2) processing capacity additions that monetize maize into higher-value derivatives, and (3) yield and input-efficiency technologies that address climate volatility and fertilizer-cost pressure. On the trade and balance-sheet side, USDA WASDE updates in 2026 highlighted revisions in exports and stocks, including higher projected U.S. and Canadian corn exports for the 2026/27 marketing year in the July 2026 report, pointing to the importance of North American export programs in servicing import-dependent feed markets.
On the technology and sustainability front, published 2026 research and review work on genome editing tools (CRISPR systems applied to maize improvement) and nitrogen-efficiency pathways, including BNI-enabled maize concepts discussed in 2026 literature, supports a development pipeline aimed at climate resilience and improved nutrient use. These innovation vectors align with current restraints in the market, including climate-driven yield variability and escalating input costs, and they create room for seed providers, input companies, and grain handlers to bundle performance traits with stewardship, testing, and identity-preserved handling for food, feed, and industrial end users.
Recent Industry Developments
- June 2026: POET broke ground on an expansion at its Shelbyville, Indiana, bioprocessing facility with a stated investment of about USD 200 million to increase bioethanol capacity from 98 million to 193 million gallons. The project supports downstream pull-through for corn in a core U.S. processing corridor and indicates continued capital formation around biofuel-linked offtake.
- June 2025: Argentina approved five new genetically modified corn varieties, including traits for reduced plant height, insect resistance, and glyphosate tolerance. The approvals broaden the technology toolkit for growers and exporters and strengthen agronomic stability in one of the key global export origins.
- August 2024: Himachal Pradesh introduced a minimum support price for naturally grown maize at INR 30 (USD 0.34) per kg, positioning it as the first Indian state to set such a price for this segment. The policy provides a clearer farmgate signal for chemical-free maize and can stimulate differentiated sourcing programs for domestic feed and food channels.


Research Methodology Framework and Report Scope
Market Definition and Coverage
For this study, the maize market is defined as the traded value of maize grain across domestic and international channels, with sizing grounded in consumption value and cross-checked with production, trade flows, and price trends across major producing and importing countries.
Scope exclusions: Processed maize products made from maize (such as starches, sweeteners, and ethanol) are excluded from this market.
Segmentation Overview
- By Geography
- North America
- United States
- Canada
- Mexico
- South America
- Brazil
- Argentina
- Europe
- Spain
- Italy
- France
- Germany
- Russia
- Asia-Pacific
- India
- China
- Vietnam
- Middle East
- Turkey
- Saudi Arabia
- Africa
- South Africa
- Nigeria
- North America
Data Validation & Update Cycle
Outputs are checked against independent signals like global production totals, trade balance direction by region, and price movement logic so the value trend matches the underlying supply situation. When large variances show up, the drivers are traced back to the country level, and assumptions are revisited, followed by re-contacting relevant interviewees if the mismatch is still unresolved.
Before sign-off, the model goes through a multi-step analyst review where calculations, unit consistency, and currency conversions are rechecked, and outliers are documented with a clear rationale. Reports are refreshed annually, and interim updates are done when material events occur, such as major policy changes, sharp trade disruptions, or abnormal crop outcomes. Right before delivery, we do a fresh pass so clients receive the latest updated view.
Mordor Intelligence's Maize Market Size Compared Against Other Published Estimates
Published maize market values often differ because the scope line is not the same, and the value basis also shifts by whether the study ties dollars to traded grain or to downstream uses. Differences also show up when one publisher uses a single global average price, versus country-level pricing that follows seasonality and trade parity.
Processed maize products sit outside Mordor Intelligence's scope, which removes value that some publishers include when they count starch, sweeteners, and ethanol-linked revenue inside the same headline number. The spread can also be widened by how aggressively prices are assumed to move over time, how exchange rates are converted to USD, and how frequently assumptions are refreshed after crop surprises and policy shocks.
Benchmark comparison
| Source | Market Size | Gaps in Research Methodology |
|---|---|---|
| Mordor Intelligence | USD 320.31 B (2026) | |
| Global Research Publisher A | USD 138.90 B (2024) | Uses an earlier base year and a different market construct that appears to be organized around end-use and channels, which can understate traded grain value if farmgate-to-trade pricing and country parity effects are not fully captured. |
| Industry Research House B | USD 187.40 B (2024) | Counts maize through broad downstream applications (including industrial and renewable energy uses) and does not clearly separate raw grain from processed value pools, which can shift the headline depending on what parts of the chain are bundled together. |
Overall, the range mainly comes from what is counted as maize value and the year used for pricing and currency conversion. By keeping the scope tied to maize grain and validating totals with production, trade, and price signals, the resulting figure is easier to reconcile and repeat across regions and update cycles.


Key Questions Answered in the Report
What is the current market size of Maize Market in 2026?
The Maize Market reached USD 320.31 billion in 2026 and is projected to rise to USD 372.42 billion by 2031.
Which region will add the most incremental feed demand for corn?
Asia-Pacific is set to contribute the largest volume gain as its poultry and swine sectors scale, supporting the region's 4.96% CAGR through 2031.
What technology offers the next big yield jump in corn farming?
Short-stature hybrids that allow denser plantings and better lodging resistance are now reaching commercial farms, providing double-digit bushel advantages over conventional varieties.
How are rising fertilizer prices affecting planting decisions?
Elevated nutrient costs encourage variable-rate applications, diversified rotations, and adoption of nitrogen-efficient hybrids, particularly among cost-sensitive growers.
Page last updated on:




