
Linear Alkyl Benzene (LAB) Market Size and Share
Market Overview
| Study Period | 2021 - 2031 |
|---|---|
| Market Volume (2026) | 3.74 Million tons |
| Market Volume (2031) | 4.36 Million tons |
| Growth Rate (2026 - 2031) | 3.12% CAGR |
| Fastest Growing Market | Asia Pacific |
| Largest Market | Asia Pacific |
| Market Concentration | Medium |
Major Players
*Disclaimer: Major Players sorted in no particular order Image © Mordor Intelligence. Reuse requires attribution under CC BY 4.0. |
|
Linear Alkyl Benzene (LAB) Market Analysis by Mordor Intelligence
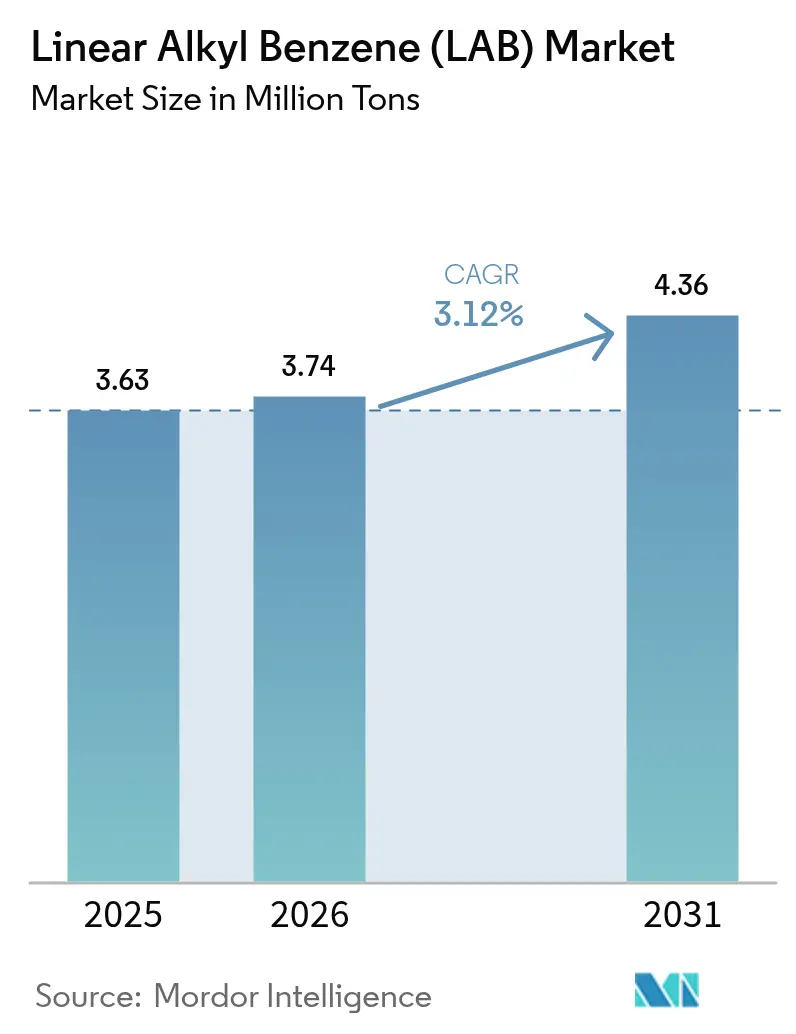
The Linear Alkyl Benzene Market size is expected to increase from 3.63 million tons in 2025 to 3.74 million tons in 2026 and reach 4.36 million tons by 2031, growing at a CAGR of 3.12% over 2026-2031. Asia-Pacific refineries are upgrading alkylation units to Detal-2 technology that cuts carbon intensity, while predictive-maintenance analytics are quietly lifting global operating rates. The interplay of technology change, rising detergent penetration in emerging economies, and tightening sustainability regulations is redefining cost curves. Feedstock volatility remains the sector’s Achilles heel, yet integrated producers buffer margin swings by securing captive benzene and n-paraffin streams. Over the forecast period, incremental demand will be met largely by new plants in Saudi Arabia and Algeria that leverage advantaged feedstock and government-backed financing.
Key Report Takeaways
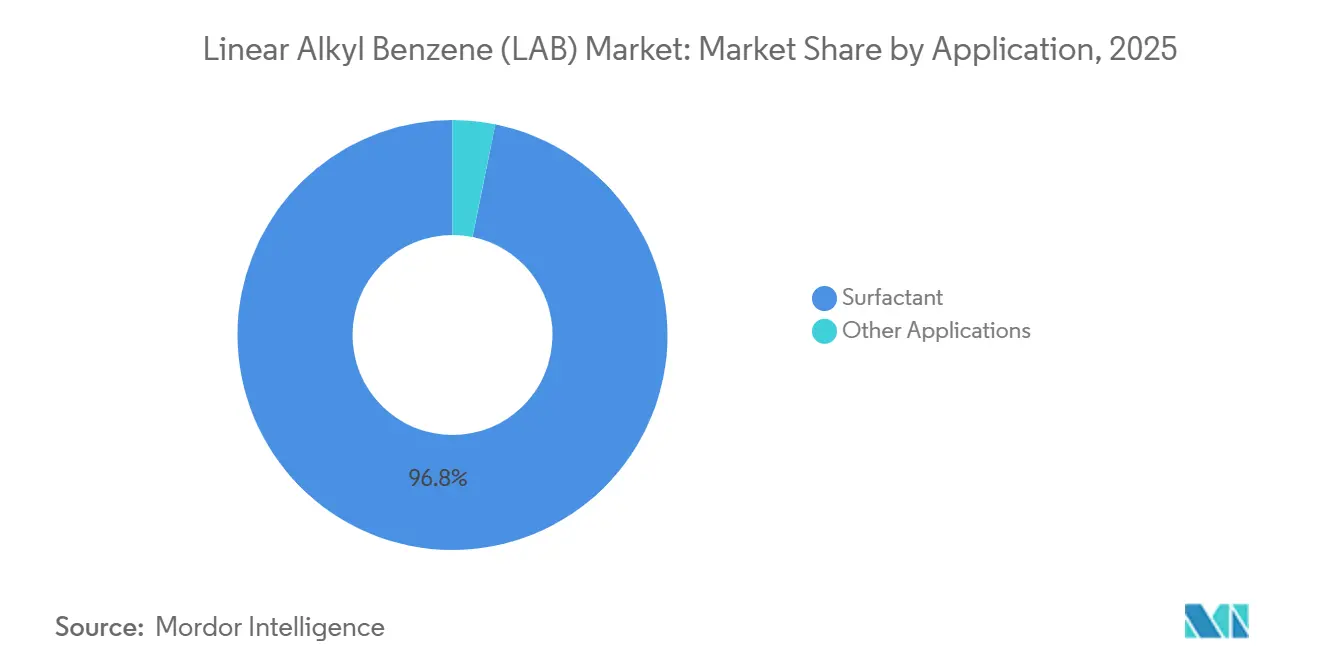
- By application, surfactants led with 96.81% revenue share in 2025, while other applications are projected to expand at 4.55% CAGR through 2031.
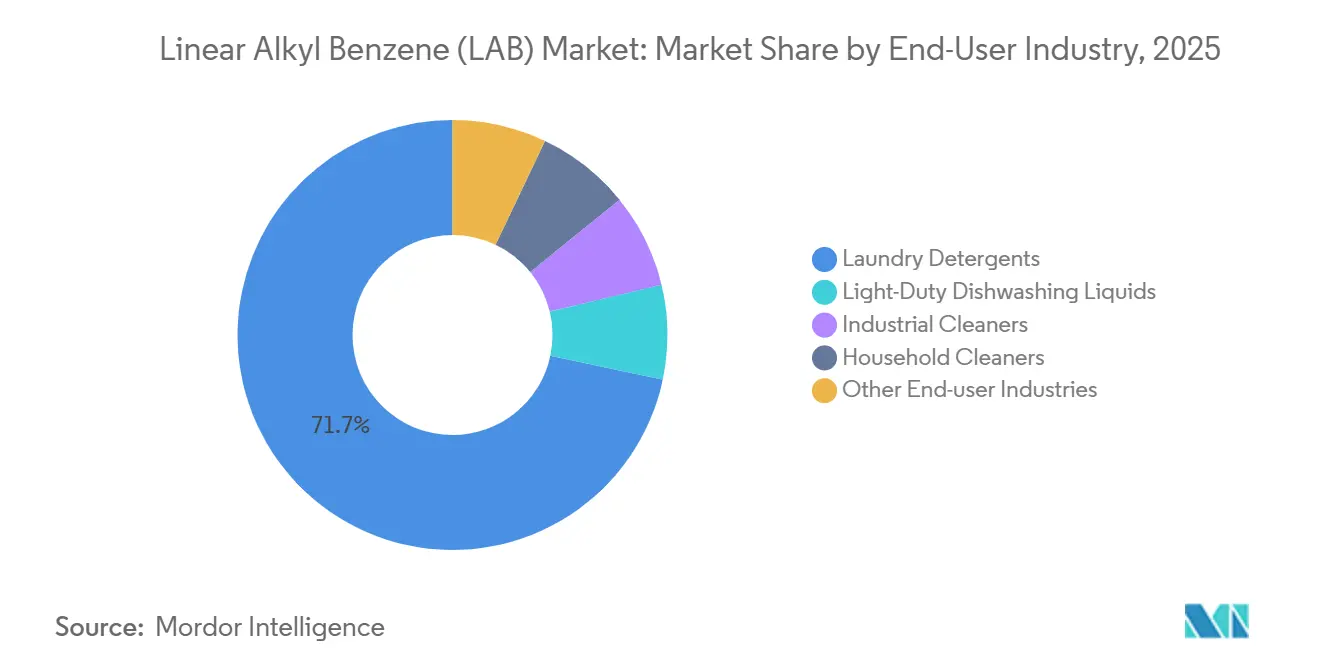
- By end-user industry, laundry detergents accounted for 71.68% of the linear alkyl benzene market share in 2025, whereas light-duty dishwashing liquids are forecast to advance at a 3.91% CAGR through 2031.
- By geography, Asia-Pacific captured 53.75% share of the linear alkyl benzene market size in 2025 and is poised to grow at 4.22% CAGR during 2026-2031.
Note: Market size and forecast figures in this report are generated using Mordor Intelligence’s proprietary estimation framework, updated with the latest available data and insights as of 2026.
Global Linear Alkyl Benzene (LAB) Market Trends and Insights
Drivers Impact Analysis*
| Drivers | (~) % Impact on CAGR Forecast | Geographic Relevance | Impact Timeline |
|---|---|---|---|
| Rising detergent penetration in emerging economies | +1.2% | Asia-Pacific (India, Southeast Asia), Sub-Saharan Africa | Medium term (2-4 years) |
| Regulatory push for biodegradable LAS surfactants | +0.7% | Europe, North America, APAC (China, Japan, South Korea) | Long term (≥ 4 years) |
| Post-COVID hygiene and cleaning intensity | +0.5% | Global, with elevated persistence in APAC and MEA | Short term (≤ 2 years) |
| Detal-2 retrofits cutting LAB carbon footprint | +0.4% | Middle East, Europe, selective Asia-Pacific sites | Medium term (2-4 years) |
| Predictive-maintenance analytics boosting plant uptime | +0.3% | Global, led by integrated producers in North America, Europe, Asia | Short term (≤ 2 years) |
| Source: Mordor Intelligence | |||
Rising Detergent Penetration in Emerging Economies
In India, Indonesia, Vietnam, and Nigeria, tier-2 and tier-3 urban centers are witnessing a surge in demand, with household penetration of branded laundry detergents projected to grow significantly by 2028. Indian manufacturers, operating at moderate capacity on their installations, have positioned the nation as a net exporter to East Africa and the Middle East. While Southeast Asian consumers are transitioning from bar soap to powder and liquid detergents, Sub-Saharan Africa is on a similar path, albeit starting from a lower baseline. This trend is bolstered by a demographic shift, with a substantial number of people expected to join the global middle class by 2030, contributing positively to the forecasted CAGR.
Regulatory Push for Biodegradable LAS Surfactants
The European Union’s REACH framework highlights faster breakdown of straight-chain LAS compared with branched analogs, making linear alkyl benzene a compliance-friendly feedstock[1]Heino Falcke et al., "BAT Reference Document for the Production of Large Volume Organic Chemicals," European Commission, eippcb.jrc.ec.europa.eu. In 2023, the European Commission proposed stricter regulations on surfactant biodegradability, prompting swift changes in formulations. Linear Alkylbenzene Sulfonate (LAS), derived from Linear Alkylbenzene (LAB), already surpasses the biodegradability threshold within 28 days, positioning it favorably against branched counterparts and certain nonionic variants. The U.S. EPA's Safer Choice program endorses LAS for institutional cleaning products, while Japan's Chemical Substances Control Law is steering the market towards purer grades. Collectively, these regulations contribute to market growth, yet they also inflate compliance costs for smaller plants without ISO 14001 certification.
Post-COVID Hygiene and Cleaning Intensity
By 2026, heightened cleaning standards will remain the norm in homes, hospitals, and logistics hubs. As a result, global consumption of Linear Alkyl Benzene (LAB) stays above pre-pandemic levels, driven by increased surfactant loadings in household wipes, floor cleaners, and industrial degreasers. This surge initially boosts the CAGR, but the effect is set to wane post-2028 as stockpiling diminishes.
Detal-2 Retrofits Cutting LAB Carbon Footprint
UOP's Detal-2 process, a solid-acid innovation, replaces hydrofluoric acid, achieving a carbon intensity reduction. Early adopters include CEPSA at its Puente Mayorga complex and Farabi Petrochemicals with its newly commissioned plant in Yanbu. Although some operators hesitate due to a retrofit downtime and significant capital investments for each unit, the allure lies in securing sustainability-linked contracts with major global detergent brands.
Restraints Impact Analysis*
| Restraints | (~) % Impact on CAGR Forecast | Geographic Relevance | Impact Timeline |
|---|---|---|---|
| Feedstock (benzene and paraffin) price volatility | -0.6% | Global, acute in Asia-Pacific and Europe | Short term (≤ 2 years) |
| HF-route environmental compliance costs | -0.3% | North America, Europe, selective Asia-Pacific sites | Medium term (2-4 years) |
| SAF kerosene pull tightening n-paraffin supply | -0.2% | Global, concentrated in regions with SAF mandates (EU, US, Asia-Pacific) | Long term (≥ 4 years) |
| Source: Mordor Intelligence | |||
Feedstock Price Volatility
In 2024-2025, benzene prices fluctuated, leading to cash cost variations for non-integrated producers of LAB. N-paraffin prices mirrored these fluctuations, influenced by refineries shifting kerosene cuts towards sustainable aviation fuel. In February 2025, LABSA spot prices in China and Europe experienced a brief uptick, driven by detergent manufacturers' restocking efforts, highlighting the challenges in long-term offtake planning.
HF-Route Environmental Compliance Costs
Due to heightened compliance costs driven by stricter U.S. EPA Risk Management Program rules and EU REACH directives, numerous European operators of hydrofluoric acid plants are either shutting down or converting their assets[2]U.S. Environmental Protection Agency, “Amendments to the Risk Management Program Rule,” epa.gov. For instance, a single retrofit to Detal-2 can be a burden too heavy for marginal facilities, resulting in a dip in growth.
*Our forecasts treat driver/restraint impacts as directional, not additive. The impact forecasts reflect baseline growth, mix effects, and variable interactions.
Segment Analysis
By Application: Surfactants Dominate, Niche Uses Accelerate
Surfactants commanded 96.81% of 2025 volume, underscoring LAB's dominant position in the production of linear alkylbenzene sulfonate. Household detergents, institutional cleaners, and industrial degreasers favor LABSA over alcohol ethoxysulfates due to its superior cost-to-performance ratio. The linear alkyl benzene market, catering to agrochemical emulsifiers, textile auxiliaries, and specialty coatings, is projected to grow at a 4.55% CAGR to 2031, driven by a shift towards water-based emulsions. In concentrated detergent formats, there's a rising demand for LABSA with high purity and a narrow molecular-weight distribution, carving out premium niches. Additionally, agrochemical clients are turning to LAB-derived emulsifiers, enhancing tank-mix stability in herbicide concentrates and presenting new revenue opportunities for producers.
Further reinforcing this outlook are second-order effects. In the Asia-Pacific, consumers are increasingly prioritizing sustainability, emphasizing lower carbon footprints and cold-water efficacy. This trend pushes formulators to opt for high-purity grades that reduce haze in low-temperature washes. Moreover, industrial surface cleaners are ramping up active-matter loadings, leading to increased LAB consumption per unit. While the surfactant segment enjoys a near-monopoly, venturing into value-added niches offers margin relief in a predominantly commoditized market.


By End-User Industry: Laundry Leads, Dishwashing Liquids Surge
Laundry detergents absorbed 71.68% of the LAB supply in 2025, underscoring the segment's prominence and the pivotal role of LABSA in both powder and liquid forms. However, light-duty dishwashing liquids are projected to grow at a 3.91% CAGR, outpacing laundry detergents. This surge is largely attributed to increasing adoption in emerging Asia, where many rural households are transitioning from traditional bar soap. The market for LAB in dishwashing liquids is poised for steady growth, especially in regions witnessing improved access to piped water. While industrial cleaners command a smaller share, they remain a consistent market, buoyed by heightened surfactant demands in hospitals, logistics hubs, and food-service venues due to post-COVID sanitation protocols.
Geographical growth patterns tell a varied story. While North America and Europe showcase maturity, countries like India, Indonesia, and Vietnam are witnessing significant detergent volume growth, driving fresh demand for LAB. Dishwashing liquids, typically containing active matter, are set to capture a significant share of the market, especially given their relatively small starting point. In response, producers are channeling investments into versatile sulfonation capacities, allowing them to pivot between grades tailored for powders, which have a lower 2-phenyl content, and those optimized for liquids, known for their superior foam stability.

Geography Analysis
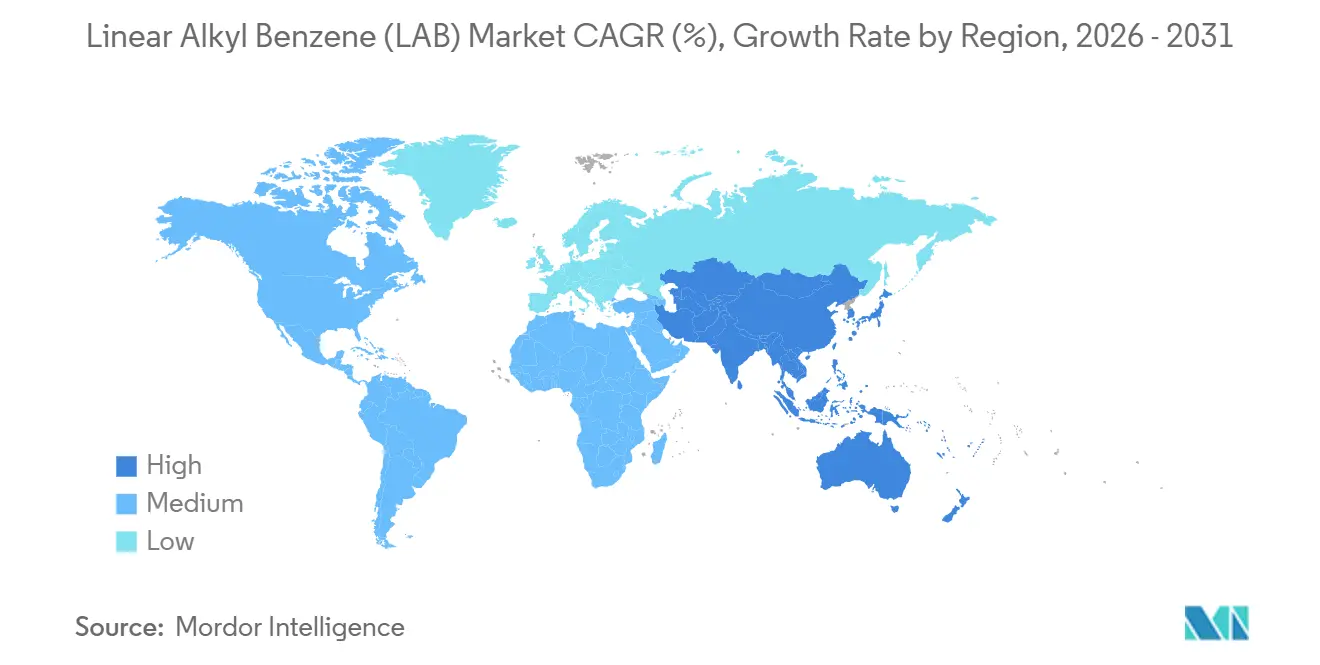
Asia-Pacific accounted for 53.75% of the 2025 volume and is forecast to post a 4.22% CAGR through 2031. Anchored by dense petrochemical clusters in Shandong, Jiangsu, Hebei, Henan, and Gujarat, China and India together consume significant quantities annually. India's installed LAB capacity surpasses its domestic consumption, facilitating exports to East Africa and the Middle East. Southeast Asia enjoys robust annual growth, driven by increased detergent penetration in Indonesia, Vietnam, and the Philippines. Meanwhile, Japan and South Korea, facing stagnant demand, are rationalizing their capacity and turning to imports of higher-purity grades from China.
North America and Europe, collectively accounting for a notable share of global demand, are witnessing slow growth rates. In the U.S., consumption is primarily driven by institutional cleaning needs. Canada, on the other hand, faces stagnant demand, largely due to intense competition from private labels. European producers are contending with the dual challenges of HF-route compliance costs and an influx of lower-priced LABSA imports, leading to accelerated capacity attrition. However, the EU's biodegradability regulations set a baseline for LAS-based detergents, ensuring a stable, albeit slow, demand in the region.
The Middle East and Africa are positioning themselves as pivotal supply hubs. Farabi Petrochemicals launched its Detal-2 unit in Yanbu, sealing an offtake agreement that ties pricing to carbon-intensity metrics. Algeria is set to unveil a plant in Skikda, directing its output towards West African markets. Meanwhile, QatarEnergy is capitalizing on low-cost ethane to offer competitive spot prices in Asia. South America, spearheaded by Brazil and Argentina, is witnessing modest growth, constrained by freight economics and import tariffs.

Regulatory Landscape
Regulation affecting LAB continues to be shaped by chemical safety frameworks and product standards, alongside trade-remedy tools in major importing markets. In Europe, LAB obligations sit within REACH (EC 1907/2006) and associated classification and labeling requirements under CLP, reinforcing documentation, registration, and downstream stewardship expectations for producers and importers.
India combines trade controls with periodic quality-control enforcement adjustments that affect import flows and near-term availability. The Directorate General of Trade Remedies issued final findings on March 26, 2025 in the anti-dumping investigation covering LAB from Iran, Qatar, and China PR. The Central Board of Indirect Taxes and Customs also issued CAVR Review Order No. 01/2025-Customs (effective September 26, 2025 to September 25, 2026) for import valuation of LAB under HS Code 38170011. In March 2026 and June 2026, the Ministry of Chemicals and Fertilizers issued orders suspending the Linear Alkyl Benzene quality-control requirements for defined windows in 2026, temporarily shifting assurance burdens toward supplier qualification and buyer-side testing during supply disruptions.
Value Chain Analysis
The LAB value chain starts with refinery and petrochemical streams that provide benzene (from reforming or steam cracking) and C10-C14 n-paraffins (typically from kerosene/gas oil cuts). Producers convert n-paraffins to olefins via dehydrogenation and then alkylate benzene to produce LAB, most of which is subsequently sulfonated to LAS/LABSA for detergents, anchoring demand as surfactants dominate end use in the report scope.
Technology and integration choices shape competitiveness across the chain. Solid-acid alkylation routes such as Honeywell UOP Detal have displaced many legacy HF/AlCl3 units due to safety and environmental compliance considerations. Integrated sites (refinery-to-LAB-to-sulfonation) reduce exposure to benzene and normal-paraffin volatility and improve supply reliability for detergent formulators. The producer ecosystem includes integrated players and regional specialists such as Moeve, Sasol, Farabi Petrochemicals, Indorama Ventures, Reliance Industries, ELAB, and EMALAB. Recent capacity actions, including Tamilnadu Petroproducts' steps around its LAB expansion, illustrate how downstream customer proximity and feedstock access influence investment decisions.
Competitive Landscape
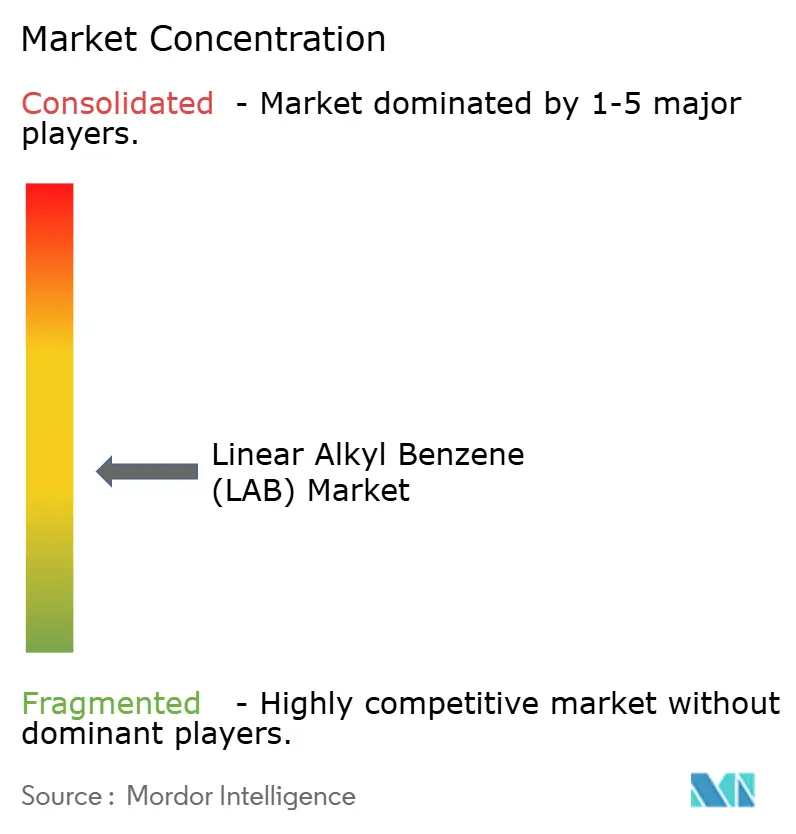
The linear alkyl benzene market is moderately fragmented. Smaller regional players deploy flexible sulfonation assets to serve both powder and liquid segments, preserving competitiveness in the face of import pressure. Constraints remain. Feedstock volatility, HF-route liabilities, and SAF-driven kerosene diversion squeeze margins for non-integrated producers. However, incumbents that combine integration, Detal-2 technology, and digital operations are well positioned to defend share against low-cost entrants.
Linear Alkyl Benzene (LAB) Industry Leaders
-
Moeve
-
Sasol
-
Farabi Petrochemicals Company
-
Indorama Ventures Public Company Limited
-
Reliance industries Limited
- *Disclaimer: Major Players sorted in no particular order

Market Opportunities and Future Outlook
Capacity additions and asset revamps are clustering around integrated, feedstock-advantaged hubs, which creates whitespace for import substitution in structurally deficit regions. In Africa, the opportunity is tied to moves to localize detergent intermediates. Dangote Petroleum Refinery announced plans for a 400,000 MTPA LAB plant in Ibeju-Lekki, Nigeria, using Honeywell technology and targeting completion within 30 months. In Egypt, ELAB paired record 2025 output (141,000 tonnes) with a May 2026 selection of Honeywell UOP technology to increase normal paraffin production, directly addressing an upstream constraint for LAB operations.
In Asia, opportunities focus on reliability upgrades and product mix shifts tied to tighter sustainability and performance requirements in detergent formulations. Tamilnadu Petroproducts brought expanded LAB capacity online on March 11, 2026, lifting installed capacity from 120,000 to 145,000 MTPA. That supports regional supply security and enables optimization toward higher-purity grades used in concentrated and cold-water detergent formats. Across geographies, the shift away from HF-route exposure toward solid-acid (Detal-type) alkylation, alongside supplier qualification demands from global detergent brands, is increasing the practical value of technology licensing, certification readiness, and integrated normal-paraffin availability.
Recent Industry Developments
- June 2026: The Government of India temporarily suspended the Linear Alkyl Benzene (Quality Control) Order for a defined period in 2026 to address supply chain disruption. The suspension eased near-term compliance gating for imported and domestically supplied LAB, shifting emphasis to commercial quality assurance and buyer-side specifications during the window.
- November 2025: Moeve expanded its collaboration with Honeywell UOP to scale bio-based LAB, including commercialization of NextLab-R at industrial scale for renewable detergent intermediates. The partnership strengthens a pathway for detergent and surfactant producers to qualify lower-carbon LAB inputs using established process technology and licensing support.
- September 2025: Farabi Petrochemicals inaugurated its fourth integrated LAB plant in Yanbu, Saudi Arabia, adding 120,000 metric tons per year of capacity. The start-up increased Middle East export availability and reinforced the region's role as a swing supplier into Asia and other importing markets.


Research Methodology Framework and Report Scope
Market Definition and Coverage
For this study, the market covers linear alkyl benzene (LAB) supplied for detergent and cleaning value chains, tracked as industry volume converted into market value using regional price assumptions and trade parity adjustments.
Scope exclusions: We exclude downstream linear alkylbenzene sulfonate (LAS) value, on-site captive transfers that are not priced, and unrelated alkylate intermediates outside LAB.
Segmentation Overview
-
By Application
- Surfactant
- Other Applications
-
By End-User Industry
- Laundry Detergents
- Light-Duty Dishwashing Liquids
- Industrial Cleaners
- Household Cleaners
- Other End-user Industries
-
By Geography
-
Asia-Pacific
- China
- India
- Japan
- South Korea
- Rest of Asia-Pacific
-
North America
- United States
- Canada
- Mexico
-
Europe
- Germany
- United Kingdom
- France
- Italy
- Russia
- Rest of Europe
-
South America
- Brazil
- Argentina
- Rest of South America
-
Middle-East and Africa
- Saudi Arabia
- South Africa
- Rest of Middle-East and Africa
-
Asia-Pacific
Data Validation & Update Cycle
Validation is done in steps so that one noisy input does not distort the final value. Our analysts compare outputs against independent signals such as regional trade balances, implied consumption per capita in detergent-heavy regions, and the feasibility of supply given installed capacity and typical downtime. When a variance looks large, the driver is isolated, assumptions are revisited, and respondents are re-contacted if the gap is tied to pricing lags, utilization, or a new capacity event.
Before sign-off, the model and key assumptions pass through an internal review, followed by consistency checks across regions and years to catch currency and unit conversion issues. Reports are refreshed annually, and interim updates are made when material events occur, such as major plant start-ups, prolonged outages, or sharp feedstock shocks. Right before delivery, a final pass is completed so clients receive the most current view available.
Mordor Intelligence's Linear Alkyl Benzene Lab Market Estimate Compared With Other Published Estimates
Published LAB market sizes often vary because the same physical volume can be turned into very different USD totals depending on when prices are captured and how currencies are converted. Differences also show up when one study leans on headline demand narratives while another study forces the numbers to reconcile with trade, capacity, and utilization signals.
In our work, the main gap drivers were refresh cadence, FX timing, and the price-per-ton logic used to translate tons into USD, which is sensitive to contract lag and regional benchmark choice. By updating price assumptions after major feedstock moves and rechecking the implied volume against trade direction and operating rate bands, Mordor Intelligence reduces swings that come from using a single-year average price or older exchange rates.
Benchmark comparison
| Source | Market Size | Gaps in Research Methodology |
|---|---|---|
| Mordor Intelligence | USD 4.75 B (2026) | |
| Global Consultancy A | USD 9.66 B (2025) | Uses a value-first view with limited visibility on tonnage-to-value conversion steps, and the price basis year and FX timing are not clearly tied to regional contract lag behavior. |
| Industry Publisher B | USD 4.53 B (2024) | Appears to focus on sales-revenue reporting for a narrower realized-sales pool, which can undercount captive volumes and can dampen price uplift if spot cycles are averaged out. |
The spread is mainly explained by how each estimate treats the conversion from tons to USD and how quickly assumptions are refreshed when feedstock and FX conditions shift. When the scope is kept strictly at LAB and the value build is repeatedly checked against capacity, trade, and utilization realism, the result becomes easier to trace and repeat across years.


Key Questions Answered in the Report
What is the projected volume for the linear alkyl benzene market in 2031?
Global demand is expected to reach 4.36 million tons by 2031, expanding at a 3.12% CAGR from 3.74 million tons in 2026.
Which region is growing fastest in LAB consumption?
Asia-Pacific leads with a 4.22% CAGR through 2031, driven by detergent penetration gains in India, China, and Southeast Asia.
How much LAB volume went into surfactants in 2025?
Surfactants used 96.81% of global LAB volume in 2025, underscoring their dominance in total demand.
Why are Detal-2 plants attracting attention?
The technology removes hydrofluoric acid, lowers carbon intensity, and aligns with brand-owner sustainability mandates.
What is driving the rise of dishwashing liquids?
Urbanization and changing hygiene habits in emerging Asia boost penetration, making dishwashing liquids the fastest-growing end-user segment at 3.91% CAGR.
Page last updated on:




