
Hydrogen Cyanide Market Size and Share
Market Overview
| Study Period | 2021 - 2031 |
|---|---|
| Market Volume (2026) | 2.41 Million tons |
| Market Volume (2031) | 2.63 Million tons |
| Growth Rate (2026 - 2031) | 1.77% CAGR |
| Fastest Growing Market | Asia Pacific |
| Largest Market | North America |
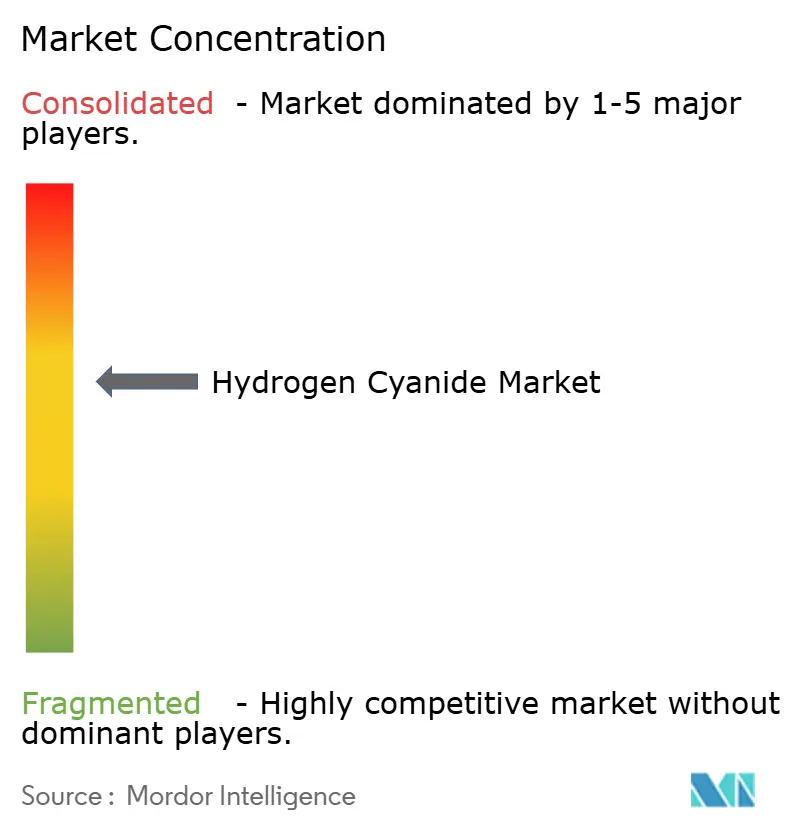
| Market Concentration | Medium |
Major Players *Disclaimer: Major Players sorted in no particular order Image © Mordor Intelligence. Reuse requires attribution under CC BY 4.0. | |
Hydrogen Cyanide Market Analysis by Mordor Intelligence
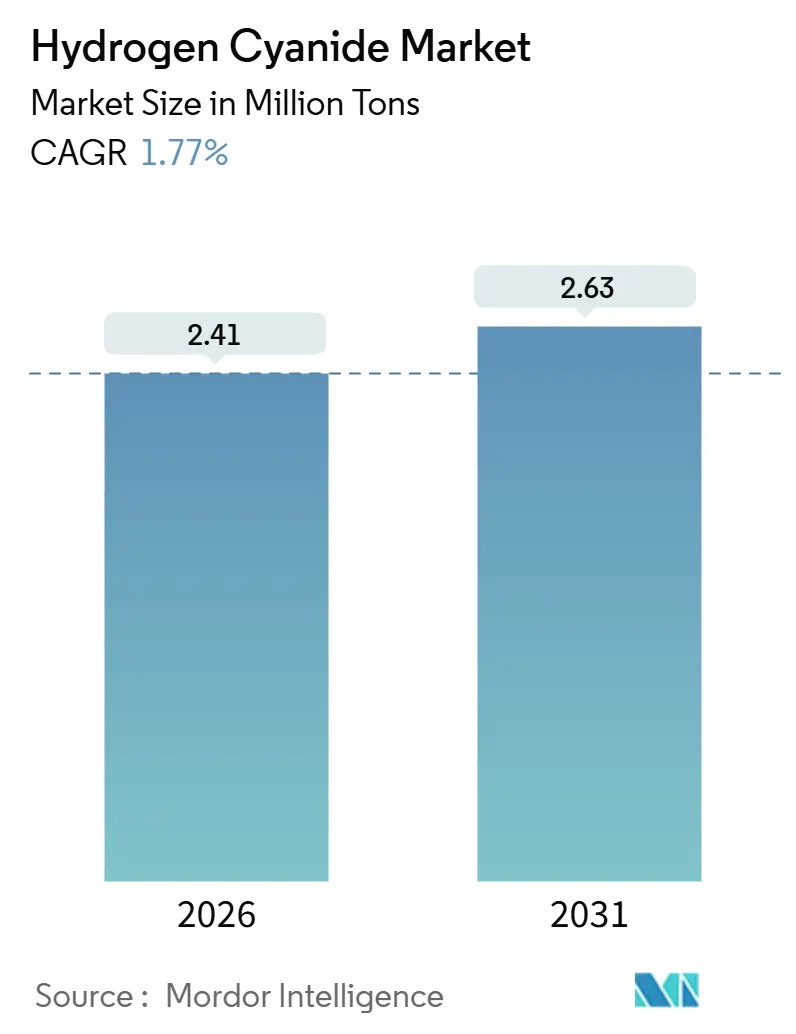
The Hydrogen Cyanide Market size is estimated at 2.41 million tons in 2026, and is expected to reach 2.63 million tons by 2031, at a CAGR of 1.77% during the forecast period (2026-2031). This moderate expansion underscores the chemical’s status as a captive intermediate rather than a freely traded bulk commodity, so demand tracks the cycles of downstream uses such as adiponitrile for nylon 6,6, cyanide salts for gold leaching, acetone cyanohydrin for methyl methacrylate, and methionine for animal feed. North America commands the largest slice of global volume because Gulf Coast complexes co-produce HCN and acrylonitrile, while Asia-Pacific leads growth thanks to nylon and methionine capacity build-outs in China and India. Feedstock pricing remains the principal swing factor; natural-gas and ammonia costs account for roughly two-thirds of variable expenditure, so regional arbitrage emerges when gas hubs diverge. Regulatory risk is equally salient: OSHA’s 10 ppm eight-hour exposure limit and REACH Annex XIV authorization keep compliance spending elevated, reinforcing the advantages of vertically integrated incumbents.
Key Report Takeaways
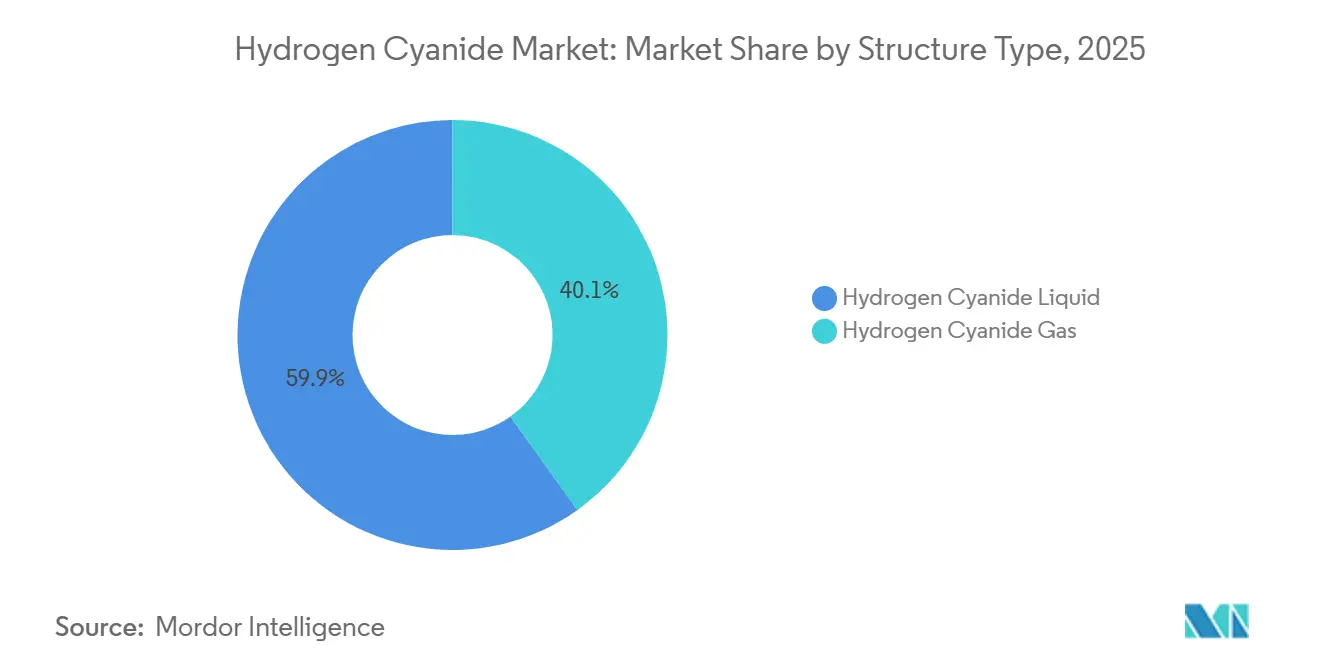
- By structure type, hydrogen cyanide liquid captured 59.87% of the 2025 volume, whereas the gas segment is forecast to expand at a 2.01% CAGR through 2031.
- By application, adiponitrile accounted for 39.98% consumption in 2025, and sodium and potassium cyanide are poised to grow at a 1.92% CAGR to 2031.
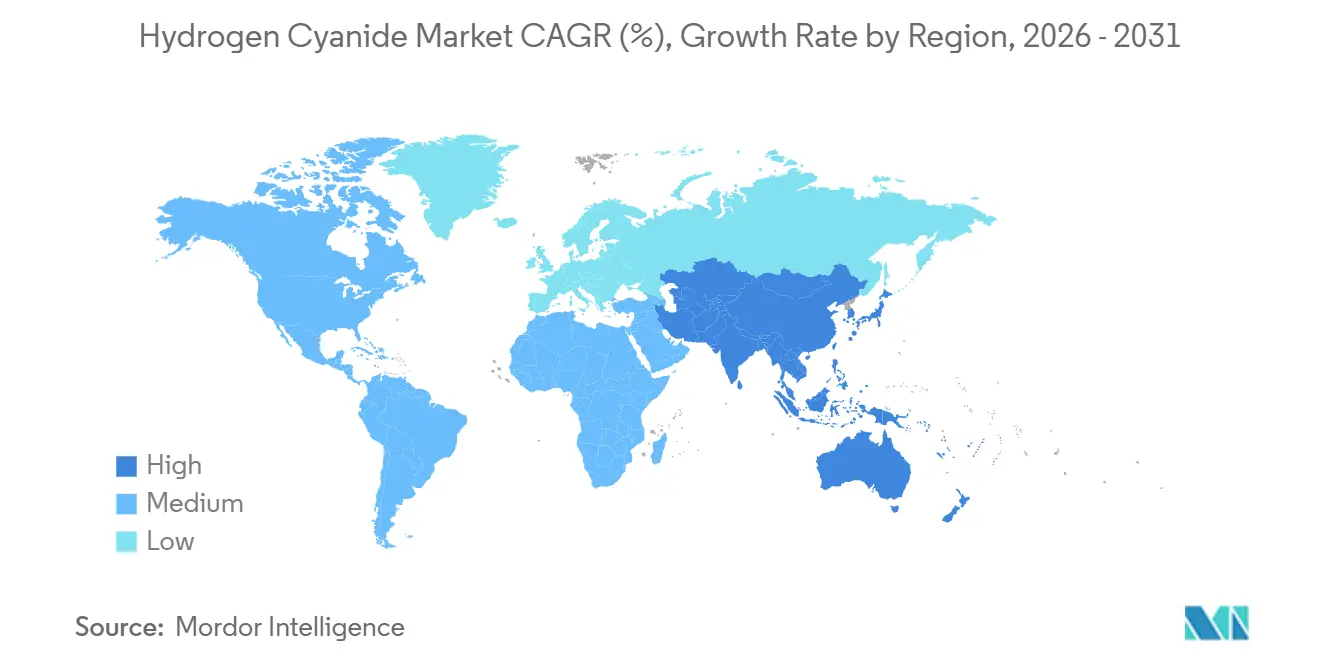
- By geography, North America led with a 37.22% share in 2025, while Asia-Pacific is projected to advance at a 1.98% CAGR through 2031.
Note: Market size and forecast figures in this report are generated using Mordor Intelligence’s proprietary estimation framework, updated with the latest available data and insights as of January 2026.
Global Hydrogen Cyanide Market Trends and Insights
Drivers Impact Analysis*
| Drivers | (~) % Impact on CAGR Forecast | Geographic Relevance | Impact Timeline |
|---|---|---|---|
| Favorable demand for NaCN and KCN production | +0.4% | Global, with concentration in South America, Africa, and Asia-Pacific mining belts | Medium term (2-4 years) |
| Increasing adiponitrile demand for nylon 6,6 | +0.5% | North America and Europe (automotive), Asia-Pacific (textiles and industrial) | Long term (≥4 years) |
| Rising methionine demand in animal feed | +0.3% | Asia-Pacific core (China, India, Southeast Asia), spillover to Middle East | Medium term (2-4 years) |
| Integration of HCN with acrylonitrile complexes | +0.2% | Global, particularly North America Gulf Coast and Northeast Asia petrochemical hubs | Short term (≤2 years) |
| ESG-driven shift to low-carbon H₂/NH₃ feedstocks | +0.1% | Europe and North America (early movers), gradual adoption in Asia-Pacific | Long term (≥4 years) |
| Source: Mordor Intelligence | |||


Favorable Demand for NaCN and KCN Production
Gold producers account for a significant portion of global HCN consumption in cyanide salts. With bullion prices rising in 2024-2025, marginal-ore processing saw a notable uptick. Mining giants turned to certified suppliers, while by late 2025, the International Cyanide Management Institute had audited numerous sites across various countries [1]International Cyanide Management Institute, “Cyanide Code Signatories and Certified Operations,” cyanidecode.org. In Peru, Ghana, and Western Australia, heap-leach projects spurred increased briquette shipments, bolstering medium-term offtake commitments. Although pilot plants experimenting with thiosulfate and glycine signal a potential future shift, these alternatives still lag behind cyanide in both recovery rates and reagent costs. As a result, volumes of sodium and potassium cyanide are poised for a modest increase until post-2028, when alternative leaching methods achieve cost parity.
Increasing Adiponitrile Demand for Nylon 6,6
INVISTA, a major player in the nylon industry, has committed significant investments to expand its global nylon 6,6 operations, targeting applications in connectors, battery modules, and high-temperature hoses. China's production of nylon 6,6 has increased, leading to a boost in adiponitrile capacity. This move ensures that the Asia-Pacific region will remain in a structural deficit until new feedstock debottlenecks are introduced. While electric vehicle designs aim to reduce the overall polymer weight in cars, the demand for heat-resistant components balances this reduction, indicating a sustained long-term demand. Furthermore, automotive lightweighting regulations in both the European Union and the United States bolster the preference for nylon 6,6 over traditional metals. As the industry approaches a pivotal capacity expansion mid-decade, producers are keenly watching EV sales trends to sidestep potential overbuilding.
Rising Methionine Demand in Animal Feed
Asia-Pacific, leading the world in poultry and aquaculture production, drives a demand for methionine that significantly impacts global HCN consumption[2]Food and Agriculture Organization, “Global Methionine Production and Animal Feed Applications,” fao.org. While enzyme-based alternatives exist, the cyanohydrin route remains the dominant method for chemical synthesis. To mitigate feedstock risks, plants in China and the Middle East have secured multi-year contracts for HCN supplies. Although Evonik and Sumitomo Chemical have explored carbohydrate fermentation pathways, they haven't yet outpaced the established technology, primarily due to elevated capital expenditures and raw material costs. As regulatory bodies intensify their focus on nitrogen emissions, livestock integrators are increasingly turning to precision-nutrition programs. This shift not only elevates the inclusion rate of methionine but also bolsters its demand growth.
Integration of HCN with Acrylonitrile Complexes
Through the Sohio process, acrylonitrile plants produce HCN as a by-product. This process enables operators to profit from a by-product, eliminating the need for flares. Complexes in the Gulf Coast and Northeast Asia have mastered this co-production, reaping cost benefits over standalone Andrussow reactors, which rely on merchant ammonia. In 2024-2025, Butachimie and Shanghai Secco undertook debottlenecking initiatives, boosting regional HCN output without the need for new reactors. While on-purpose projects thrive in areas short on propylene, the heightened feedstock risk compels these assets to prioritize reliability and purity over unit cost.
Restraints Impact Analysis*
| Restraints | (~) % Impact on CAGR Forecast | Geographic Relevance | Impact Timeline |
|---|---|---|---|
| Extreme toxicity and regulatory compliance costs | -0.3% | Global, with stricter enforcement in North America and Europe | Short term (≤2 years) |
| Raw-material (natural gas, NH₃) price volatility | -0.4% | Europe (highest exposure), North America and Asia-Pacific (moderate) | Short term (≤2 years) |
| Shift to cyanide-free leaching in mining | -0.2% | South America, Africa, and Asia-Pacific mining regions | Medium term (2-4 years) |
| Source: Mordor Intelligence | |||
Extreme Toxicity and Regulatory Compliance Costs
Handling hydrogen cyanide, known for its lethality, requires a closed-loop system, continuous monitoring, and specialized transport. OSHA sets workplace exposure limits at specific levels over eight hours and for 15-minute spikes. Meanwhile, REACH Annex XIV mandates European users to secure specific authorizations. Safety measures, including scrubbers, gas detectors, and emergency showers, significantly increase the setup costs of a plant. Furthermore, using specialized railcars for transport raises logistics costs compared to standard bulk chemicals. Such financial burdens deter new entrants in greenfield projects and favor vertically integrated incumbents. These established players, who utilize HCN on-site, limit the liquidity of merchants in regions like Europe and Japan. Additionally, insurance underwriters respond to these risks by charging higher premiums, deepening the divide between seasoned producers and newcomers.
Raw-Material Price Volatility
Both the Andrussow and BMA processes utilize methane and ammonia in precise stoichiometric ratios, rendering the business vulnerable to energy market fluctuations. Amid Europe's gas crisis, ammonia prices surged significantly. This spike compelled industry giants Evonik and INEOS to reduce their merchant supply and shift focus to their in-house derivatives. In contrast, producers along the Gulf Coast benefited from lower gas prices. This advantage solidified their feedstock arbitrage, bolstering their export competitiveness. Additionally, price fluctuations play a pivotal role in shaping carbon-intensity strategies; a dip in gray benchmarks can decelerate the shift towards green ammonia. Furthermore, the limited hedging options in ammonia futures mean producers often depend on multi-year contracts, which can lead to losses if market dynamics shift unfavorably.
*Our forecasts treat driver/restraint impacts as directional, not additive. The impact forecasts reflect baseline growth, mix effects, and variable interactions.
Segment Analysis
By Structure Type: Bulk Liquids Anchor Logistics While Gas Gains Niche Traction
Liquid HCN retained 59.87% of global volume in 2025. This preference is largely due to the efficiency of pressurized railcars and ISO tanks, which transport significant volumes at a time, ensuring the lowest delivery costs for high-volume users. Established integrations along the Gulf Coast and Northeast Asia heavily influence the liquid hydrogen cyanide market. Here, plants producing adiponitrile and cyanide salts are strategically located next to rail sidings. Gas-phase demand is projected to expand at a 2.01% CAGR through 2031 as semiconductor fabs increasingly adopt micro-Andrussow generators. These generators not only eliminate the need for bulk storage but also adhere to stringent cleanroom standards. In mining hubs like Peru and Ghana, liquids are the preferred choice. Here, cyanide briquette dissolvers convert tank-truck deliveries into leach solutions at remote sites. Meanwhile, in Japan, strict regulations on stationary storage compel specialty-chemical producers to adopt on-demand gas technology, even at a higher variable cost.
Transport economics solidify the dominance of liquid hydrogen cyanide in the market. The cost per ton-kilometer for liquids is significantly lower than that of cylinderized gas. Furthermore, when shipments adhere to the ICMI Transport Protocol, insurance premiums remain reasonable. However, electronics clusters in the Asia-Pacific and wafer fabs in Europe are leaning towards point-of-use generation. This shift helps them maintain lower on-site inventory levels, in line with Seveso III regulations. Reflecting this trend, contract structures vary: nylon and mining clients predominantly opt for long-term, take-or-pay liquid contracts, while gas supply agreements tend to be shorter. Looking to the future, while investments in micro-reactors are poised to diminish the liquid's market share, the strength of bulk logistics networks and captive derivative plants will ensure liquids retain their leading position throughout the forecast period.

By Application: Adiponitrile Dominates but Cyanide Salts Capture Momentum
Adiponitrile absorbed 39.98% of the 2025 hydrogen cyanide market consumption, leveraging vertically integrated nylon 6,6 chains across North America, Europe, and China. Multiple announcements from INVISTA and Butachimie signal continued debottlenecking, yet project pacing now factors in EV adoption curves that may cap per-vehicle nylon loadings. Sodium and potassium cyanide are set to record the fastest CAGR at 1.92% through 2031 because gold prices incentivize heap-leach projects in Latin America and Africa, where ore grades trend lower but investor appetite for bullion diversifiers remains strong. Acetone cyanohydrin feeds methyl methacrylate for acrylic sheets and coatings; demand here tracks construction and automotive refinish cycles, providing mid-single-digit volume growth.
The hydrogen cyanide market size for cyanide salts is projected to expand at a measured pace, yet margins often outstrip bulk adiponitrile grades because mining clients accept price pass-through linked to precious-metal spot prices. Conversely, adiponitrile users negotiate formula contracts tied to propylene and benzene, limiting upside when feedstocks fall. MMA’s dependency on construction starts exposes acetone cyanohydrin to macro swings, but renewed architectural glazing standards bolster acrylic sheet demand. Minor outlets - chelating agents, pharmaceuticals, electroplating - consume small volumes but require ultra-high purity, commanding price premiums that offset cleaning-cycle downtime. The application mix therefore delivers a balanced portfolio, with commodity streams anchoring volume and specialty grades fortifying profitability.


Geography Analysis
North America’s 37.22% hydrogen cyanide market share in 2025 traces to decades-old Gulf Coast integration that co-locates shale-derived natural-gas liquids, ammonia, acrylonitrile, adiponitrile, and nylon 6,6. Co-production grants cost resilience, allowing operators to flex HCN output in sync with downstream resin demand without incurring merchant logistics. Automotive OEMs still specify nylon 6,6 for under-hood parts where thermal cycling and fluid resistance trump cost considerations. Nonetheless, feedstock hedging became essential after the 2022 ammonia spike, prompting long-term contracts with nitrogen producers and sparking early feasibility studies on green ammonia offtake.
Asia-Pacific expands at 1.98% CAGR through 2031, led by China’s policy push for nylon 6,6 self-sufficiency, India’s protein-consumption boom, and Southeast Asia’s electronics build-out. Hebei Chengxin and CNPC added dedicated HCN capacity during 2024-2025, trimming imports and tempering regional price volatility. Evonik and Sumitomo Chemical supply methionine complexes in Saudi Arabia and Singapore under long-term HCN tolling, reflecting growing Middle Eastern participation in animal-nutrition value chains. Japan and South Korea mitigate logistics constraints via onsite generation technology licensed from Air Liquide and Linde, thereby sidestepping bulk-storage regulatory hurdles.
Europe’s share contracted as energy costs rendered on-purpose HCN production uneconomic against imported alternatives. Evonik and INEOS re-optimized assets for captive MMA and specialty chemicals, while merchant volumes increasingly originate from the United States and the Middle East where feedstock spreads are favorable. South American demand clusters around cyanide consumption in Peru, Chile, and Brazil, served by Cyanco and Draslovka through solid briquette logistics that tolerate remote terrain. The Middle East holds latent potential: abundant gas and ammonia in Saudi Arabia could underpin export-oriented plants, yet, in the absence of domestic derivatives, such projects must clear qualification and shipping barriers to penetrate distant markets. Africa remains consumption-centered on mining, with modest local production in South Africa and import reliance elsewhere.

Regulatory Landscape
Hydrogen cyanide regulatory exposure is largely shaped by worker-safety and major-accident controls, which increase fixed compliance costs and support closed-loop, integrated consumption. In the United States, OSHA maintains a permissible exposure limit (PEL) of 10 ppm (11 mg/m3) as an 8-hour TWA for hydrogen cyanide, while NIOSH lists an IDLH value of 50 ppm, which pushes continuous monitoring, emergency response readiness, and specialized handling practices at both producing and consuming sites.
In Europe, hydrogen cyanide falls under the ECHA framework (REACH registration and CLP classification), reinforcing documentation, risk management measures, and supply-chain communication for industrial intermediates. Separately, trade and downstream regulatory actions affect end-use adoption: hydrogen cyanide is classified under HS 2811.12.00 for customs purposes, and in April 2026 the US EPA published pesticide tolerance actions tied to registration review decisions that include hydrogen-cyanide-related compounds, highlighting how regulatory decisions in end-use categories can feed back into demand for cyanide chemistry and compliance scrutiny.
Value Chain Analysis
The hydrogen cyanide value chain begins with energy-linked feedstocks (natural gas and ammonia) and two main production routes, the Andrussow process (ammonia, methane, and air over platinum-based catalysts) and the BMA (Degussa) process (ammonia and methane without oxygen at higher temperatures). A meaningful share of supply also comes as a co-product from acrylonitrile (Sohio) complexes, which ties hydrogen cyanide availability to acrylonitrile operating rates and supports concentration in integrated petrochemical hubs.
Given the safety burdens associated with transporting and storing neat HCN, most volumes are consumed captive within integrated sites and routed into downstream derivatives such as adiponitrile (nylon 6,6), acetone cyanohydrin (MMA chain), and metal cyanides (NaCN/KCN) for mining. Technology and capability providers (for example, Roehm GmbH as a licensor of Andrussow and BMA process technology) support optimization and debottlenecking, while distribution is typically confined to short-haul movements via pressurized railcars, ISO tanks, and tightly controlled terminals with specialized safety systems and documentation.
Competitive Landscape
The hydrogen cyanide market is moderately consolidated. The extreme toxicity of hydrogen cyanide raises capital expenses, deterring new entrants. Meanwhile, long-term contracts for ammonia and propylene feedstocks further entrench these incumbents. Recent patents underscore the industry's shift towards co-production efficiency. Decarbonization has become the focal point of strategic initiatives. Suppliers traditionally aligned with mining are carving a niche in service differentiation. They offer on-site detox systems, ICMI certification, and reagent audits, solidifying their position in cyanide salts without directly competing with giants in the bulk HCN arena.
Hydrogen Cyanide Industry Leaders
INVISTA
Butachimie
Evonik Industries AG
INEOS
Draslovka
- *Disclaimer: Major Players sorted in no particular order

Market Opportunities and Future Outlook
Near-term opportunities focus on de-risking supply and compliance in applications that already rely on cyanide chemistry, rather than expanding merchant trade in neat HCN. The mining reagent chain remains a practical whitespace for service-led differentiation, where suppliers combine NaCN/KCN deliveries with onsite detox systems, audits, and alignment with the International Cyanide Management Institute (ICMI) code expectations cited in the market context. This improves qualification with large gold operations and strengthens the link between cyanide salts and integrated HCN sourcing.
A second opportunity involves demand creation and portfolio diversification through battery and specialty-material adjacencies that use cyanide intermediates without requiring large-scale merchant HCN logistics. Reuters reporting on Draslovka points to active movement toward sodium-ion battery materials such as Prussian blue, and the market context further notes company actions that pair product supply with logistics and terminal infrastructure. Together, these factors support pull-through for cyanide intermediates in localized, integrated supply chains where safety, permitting, and transport constraints can outweigh the economics of long-distance shipment.
Recent Industry Developments
- March 2026: Draslovka announced a multi-year sodium cyanide supply contract with Barrick Mining Corporation for Nevada Gold Mines and tied it to an expansion of its handling terminal in Carlin, Nevada. The deal strengthens secured offtake into a major gold-mining district and adds logistics capability that supports reliable cyanide reagent supply under tight safety and transport requirements.
- March 2025: Bloomberg and Reuters reported that Draslovka is expanding into battery-related applications, including sodium-ion battery materials such as Prussian blue. This strategic move diversifies demand beyond gold leaching and encourages tighter integration between cyanide intermediates, specialty materials qualification, and regionally anchored supply chains.
- August 2024: Navoiyazot commissioned a new cyanide salts production complex in Uzbekistan, including 8,000 tons per year of hydrogen cyanide capacity and 80,000 tons per year of liquid sodium cyanide. The startup adds regional production depth for cyanide intermediates and can reduce import dependence for mining and chemical users that require consistent supply under hazardous-material handling constraints.


Research Methodology Framework and Report Scope
Market Definition and Coverage
For this study, the hydrogen cyanide market covers the global supply and demand of hydrogen cyanide (HCN) across liquid and gas forms, measured in volume, and mapped to the main downstream chemical uses that drive consumption.
Scope exclusions: We exclude the value of downstream derivatives and finished goods (for example, nylon, methyl methacrylate, or gold) and count only hydrogen cyanide volumes.
Segmentation Overview
- By Structure Type
- Hydrogen Cyanide Liquid
- Hydrogen Cyanide Gas
- By Application
- Sodium Cyanide and Potassium Cyanide
- Adiponitrile
- Acetone Cyanohydrin
- Other Applications
- By Geography
- Asia-Pacific
- China
- India
- Japan
- South Korea
- ASEAN Countries
- Rest of Asia-Pacific
- North America
- United States
- Canada
- Mexico
- Europe
- Germany
- United Kingdom
- France
- Italy
- Spain
- Russia
- NORDICS Countries
- Rest of Europe
- South America
- Brazil
- Argentina
- Rest of South America
- Middle-East and Africa
- Saudi Arabia
- South Africa
- Rest of Middle-East and Africa
- Asia-Pacific
Data Validation & Update Cycle
Outputs were validated through stepwise checks that compare final volumes against independent signals, such as capacity additions, utilization ranges, and downstream production trends that should move in the same direction as HCN demand. If a region showed unusual jumps, the assumptions behind conversion factors, trade flows, and plant operating rates were re-checked, and when needed, experts were re-contacted to confirm whether a real event (shutdown, expansion, or sustained demand shift) explained the variance.
Before sign-off, the work is reviewed by another analyst to confirm math integrity, unit consistency, and that the scope rules were applied the same way across regions and years. Reports are refreshed annually, with interim updates when material events occur, and a final pre-delivery review pass is completed so clients receive the latest updated view.
Mordor Intelligence's Hydrogen Cyanide Market Sizing Compared With Other Published Estimates
Published market sizes for hydrogen cyanide can look far apart, even when they describe the same industry, because the underlying unit of measure and what gets counted can be different. Some sources present a revenue number for traded product, while others track physical production and consumption where captive use is common, which can shift the total quickly.
The table shows a clear spread between a volume-based total and revenue-based totals, and in Mordor Intelligence's model the market is measured in million tons and includes captive volumes linked to integrated chemical sites, instead of converting everything into USD using assumed prices that can vary by region and contract type.
Benchmark comparison
| Source | Market Size | Gaps in Research Methodology |
|---|---|---|
| Mordor Intelligence | USD 2.41 M (2026) | |
| Global Consultancy A | USD 1.35 B (2024) | Reported as revenue for a global HCN market and appears to rely on price and channel assumptions, which can undercount captive volumes and shift totals when contract pricing is not transparent. |
| Industry Publisher B | USD 1.50 B (2024) | Uses a revenue frame with a long-range growth curve, but the scope signals suggest derivative-led segmentation and higher growth assumptions that may not reconcile with the slower, captive-intermediate consumption pattern. |
Overall, the comparison mainly reflects different units and counting rules, rather than a simple disagreement on direction. By keeping the inputs tied to downstream throughput, capacity, and utilization checks, the final view stays traceable to observable chemical activity and can be repeated when fresh operating updates appear.


Key Questions Answered in the Report
How large will the hydrogen cyanide market be by 2031?
Global volume is expected to reach 2.63 million tons by 2031, marking a 1.77% CAGR from 2.41 million tons in 2026.
Why is liquid hydrogen cyanide preferred over gas in bulk applications?
Pressurized railcars and ISO tanks can move 20-25 tons per shipment, lowering delivered cost for large users, whereas cylinders deliver only kilogram amounts and raise handling expenses.
Which downstream use consumes the most hydrogen cyanide today?
Adiponitrile production for nylon 6,6 leads demand, absorbing nearly 39.98% of global HCN consumption in 2025.
What is driving hydrogen cyanide demand growth in Asia-Pacific?
Capacity additions in nylon 6,6 and methionine, coupled with expanding gold-mining activity, propel regional consumption at a projected 1.98% CAGR to 2031.
How are producers addressing hydrogen cyanide’s carbon footprint?
Pilots in Europe and North America test green-ammonia feedstocks and micro-reactor technology, though widespread adoption awaits cost parity with conventional inputs.
Could cyanide-free gold-leaching technologies reduce HCN demand?
Thiosulfate and glycine pilots show promise, but mainstream adoption before 2028-2030 appears unlikely given recovery and reagent-cost hurdles.
Page last updated on:






