
Uganda Grains Market Analysis by Mordor Intelligence
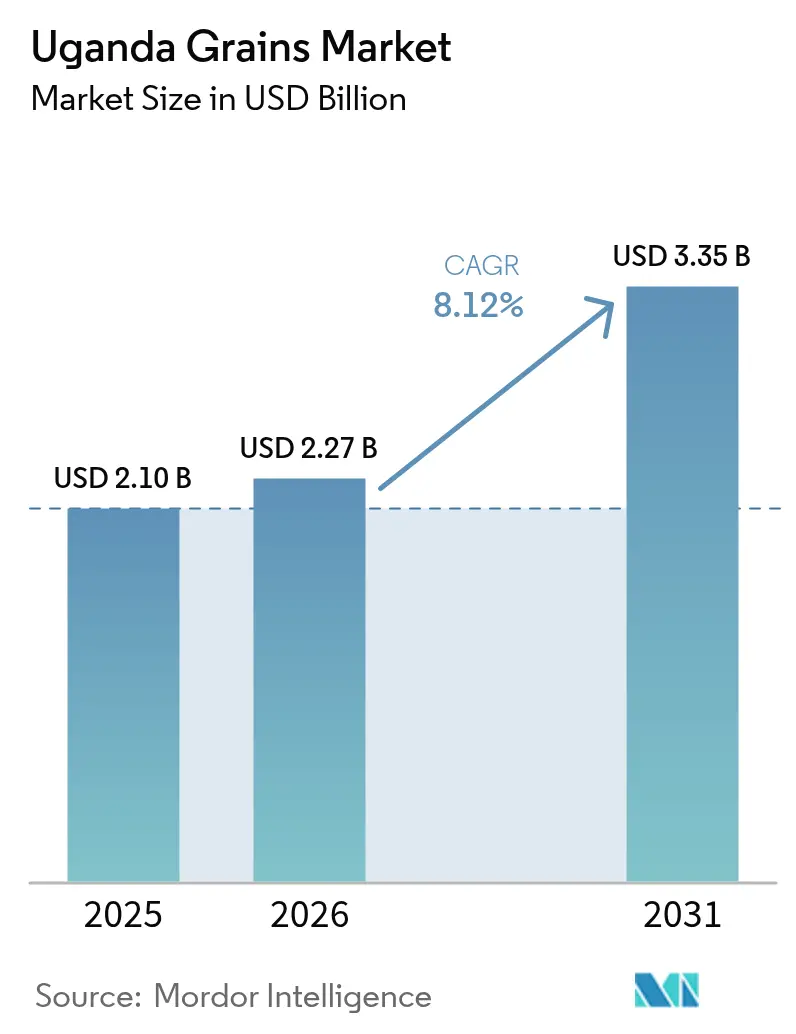
Uganda grains market size in 2026 is estimated at USD 2.27 billion, growing from 2025 value of USD 2.10 billion with 2031 projections showing USD 3.35 billion, growing at 8.12% CAGR over 2026-2031. Robust government investments in farm inputs, expanding cross-border trade volumes, and steady uptake of digital produce exchanges underpin this trajectory. Maize remains the pivotal staple, while drought-resistant varieties and fertilizer subsidies lift yields and mitigate climate risk. Private operators deploy certified silos and warehouse-receipt systems that reduce post-harvest losses and unlock affordable finance, creating fresh revenue pools for service providers. At the same time, mobile money–enabled trading apps improve price discovery and shorten cash conversion cycles for smallholder suppliers. Collectively, these trends pull Uganda closer to its ambition of becoming the East African grain corridor that satisfies growing animal-feed and food-processing demand in Kenya, the Democratic Republic of Congo, and South Sudan.
Key Report Takeaways
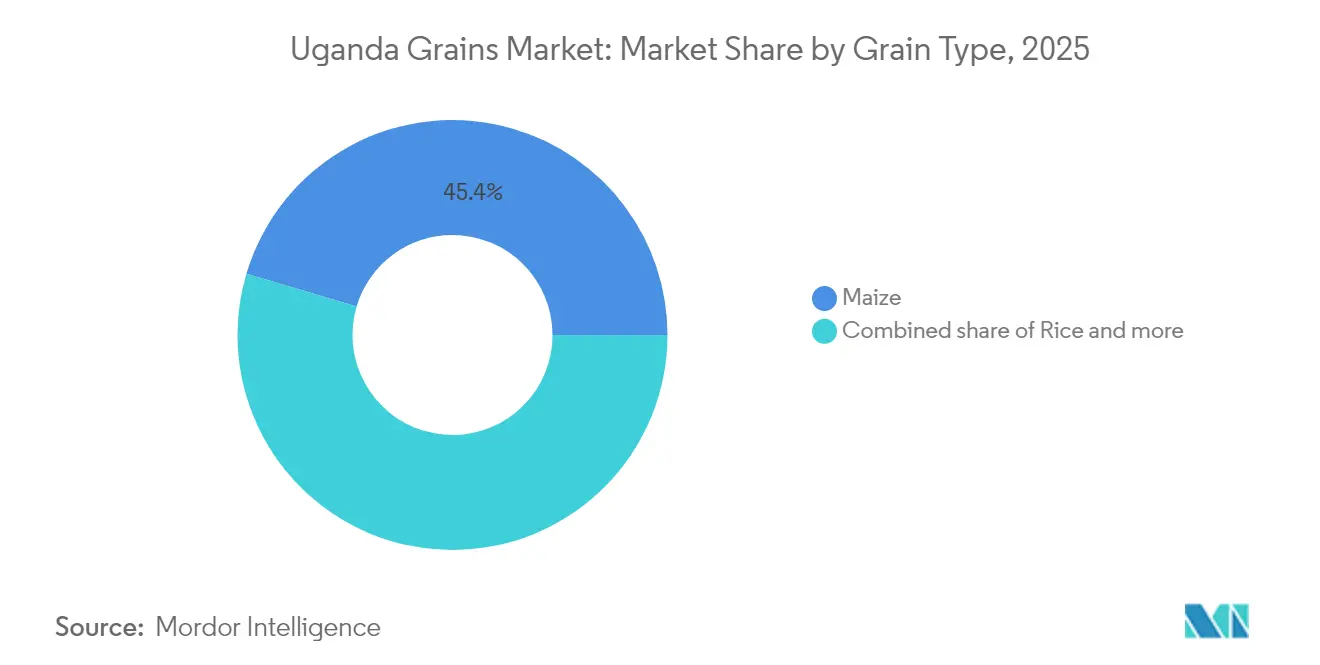
- By grain type, maize led with 45.40% of the Uganda grains market share in 2025, and rice is projected to grow at an 8.55% CAGR through 2031.
Note: Market size and forecast figures in this report are generated using Mordor Intelligence’s proprietary estimation framework, updated with the latest available data and insights as of 2026.
Uganda Grains Market Trends and Insights
Drivers Impact Analysis*
| Driver | (~) % Impact on CAGR Forecast | Geographic Relevance | Impact Timeline |
|---|---|---|---|
| Surge in regional demand for animal feed maize | + 1.8% | Uganda, Kenya, Tanzania, DRC | Medium term (2-4 years) |
| Government fertilizer subsidy roll | + 1.2% | National, with focus on Northern and Eastern regions | Medium term (2-4 years) |
| Expansion of warehouse-receipt system financing | + 0.8% | National, with pilot programs in Central and Eastern regions | Long term (≥ 4 years) |
| Emergence of digital produce exchanges | + 0.6% | National, with higher adoption in Central and Western regions | Short term (≤ 2 years) |
| Regional drought-resistant seed adoption | + 0.5% | Northern Uganda, with spillover to Eastern regions | Long term (≥ 4 years) |
| Entry of private silo operators improving post-harvest quality | + 0.4% | Central and Eastern Uganda near transport corridors | Medium term (2-4 years) |
| Source: Mordor Intelligence | |||


Surge in Regional Demand for Animal Feed Maize
Regional livestock sector expansion drives unprecedented demand for feed-grade maize in Uganda, with Uganda positioned as a primary supplier to Kenya's poultry industry and Tanzania's emerging dairy sector. Feed millers increasingly source directly from Ugandan producers, bypassing traditional commodity exchanges to secure consistent supply volumes. This trend accelerates as regional governments prioritize livestock sector development under their respective agricultural transformation programs. The UgandaFertilizer Financing Mechanism's USD 2 million guarantee facility for 60,000 metric tons of fertilizer imports directly supports maize production expansion to meet this growing feed demand [1]Source: World Bank, “Africa Fertilizer Financing Mechanism,” worldbank.org. .
Government Fertilizer Subsidy Roll
Uganda's Parliament allocated significant resources within the UGX 72.1 trillion (USD 20.4 trillion) budget for fiscal year 2024/2025 to support agricultural input subsidies, marking a strategic shift toward productivity-focused farming systems [2]Source: Parliament of Uganda, “Budget Speech FY 2024/2025,” parliament.go.ug. The program targets smallholder farmers with subsidized fertilizer access, complemented by district-level soil testing laboratories to optimize nutrient application. Early implementation phases focus on Northern and Eastern regions where soil fertility constraints limit grain yields. The initiative aligns with the National Development Plan III objectives and leverages partnerships with international fertilizer suppliers to ensure consistent supply chains.
Expansion of Warehouse-Receipt System Financing
The World Bank-supported warehouse receipt system transforms grain marketing by providing farmers with collateral-backed financing options and reducing post-harvest price volatility. Uganda exchange operates digital platforms that connect farmers directly with buyers, eliminating intermediary margins and improving price transparency. Financial institutions increasingly accept warehouse receipts as loan collateral, expanding rural credit access for agricultural investments. The system's expansion requires substantial infrastructure development, with private operators investing in certified storage facilities that meet international quality standards.
Emergence of Digital Produce Exchanges
Digital agriculture platforms revolutionize grain marketing through mobile-based price discovery and transaction facilitation, with EzyAgric scaling to over 300,000 registered farmers by 2024. The platform's partnerships with K+S fertilizer company and MFS (Mobile Financial Services) Uganda payment systems create integrated value chains that reduce transaction costs and improve market access for smallholder producers. Mobile money integration enables instant payments, addressing traditional cash flow constraints in rural grain markets. These platforms generate valuable market intelligence that informs production planning and inventory management decisions across the value chain.
Restraints Impact Analysis*
| Restraint | (~) % Impact on CAGR Forecast | Geographic Relevance | Impact Timeline |
|---|---|---|---|
| Post-harvest loss rates | -1.5% | National, with highest losses in Northern and Eastern regions | Short term (≤ 2 years) |
| Informal cross-border trade distorting domestic prices | -0.8% | Border regions with Kenya, DRC, South Sudan, Tanzania | Medium term (2-4 years) |
| Limited cold-chain infrastructure for fresh grains | -0.6% | National, with acute shortages in rural areas | Long term (≥ 4 years) |
| High aflatoxin contamination rejection rates | -0.4% | Central and Eastern regions with high humidity | Medium term (2-4 years) |
| Source: Mordor Intelligence | |||
Post-Harvest Loss Rates
Inadequate storage infrastructure causes grain losses exceeding 20% annually, representing approximately USD 420 million in economic value destruction based on the current market size in 2023. Traditional storage methods using polypropylene bags and metal silos lack moisture control and pest management capabilities, leading to quality deterioration during extended storage periods. The World Food Programme's hermetic storage technology pilot programs demonstrate 90% loss reduction potential, but adoption remains limited by high upfront costs and limited technical support [3]Source: World Food Programme Uganda, “Hermetic Storage Pilot,” wfp.org.. Rural areas particularly suffer from storage infrastructure deficits, forcing farmers to sell immediately after harvest when prices typically reach seasonal lows. Investment requirements for modern storage facilities create barriers for smallholder farmers who produce the majority of Uganda's grain output.
Informal Cross-Border Trade Distorting Domestic Prices
Extensive informal trade flows across Uganda's borders with Kenya, the Democratic Republic of Congo, South Sudan, and Tanzania create price distortions that undermine formal market development and government revenue collection. The West Nile region serves as a major smuggling hub where traders exploit price differentials and avoid customs duties, creating unfair competition for legitimate businesses. These informal channels often bypass quality standards and food safety regulations, potentially compromising consumer protection and export market access. The informal trade networks, while providing market access for remote producers, reduce incentives for investment in formal value chain infrastructure and quality improvement systems.
*Our forecasts treat driver/restraint impacts as directional, not additive. The impact forecasts reflect baseline growth, mix effects, and variable interactions.
Segment Analysis
By Grain Type: Maize Leads While Rice Accelerates
Maize commands the largest market share at 45.40% in 2025, driven by its dual role as a food staple and animal feed ingredient in Uganda expanding livestock sector. The segment benefits from Uganda's competitive production costs and strategic location for serving regional markets, with informal cross-border exports to Kenya contributing to 19% price declines in Kenyan markets during 2024. The Uganda National Bureau of Standards provides quality frameworks that support market development across all grain types, though implementation varies by segment and geographic region.,
Rice emerges as the fastest-growing segment with 8.55% CAGR through 2031, supported by government import substitution policies and expanding processing infrastructure investments by companies like Kibimba Rice and Tilda Uganda. Millet and sorghum maintain smaller but stable market positions, benefiting from growing health consciousness and traditional food preferences, particularly in Northern Uganda where these crops demonstrate superior drought tolerance.


Geography Analysis
Uganda's position as a landlocked East African nation creates unique market dynamics where domestic grain production serves both local consumption and regional export opportunities. The country's extensive arable land base of around 80% of total territory, with only 35% currently under cultivation, provides substantial expansion potential for grain production. Regional trade flows demonstrate Uganda's integration into East African markets, with maize exports to Kenya, the Democratic Republic of Congo, and South Sudan creating price linkages across borders. The West Nile region functions as a major cross-border trading hub, while the Central and Eastern regions concentrate on processing and storage infrastructure investments.
Cross-border infrastructure development enhances market access, with the Lwakhakha border upgrade to One Stop Border Post status facilitating trade with Kenya, while Lake Victoria freight services using the M.V. Mpungu vessel provide alternative transport routes for grain shipments. Government budget allocations of UGX 5.1 trillion (USD 14.4 trillion) for transport infrastructure within the fiscal year 2024/2025 budget support continued connectivity improvements.
The regulatory environment reflects Uganda Community harmonization efforts, with the Uganda National Bureau of Standards implementing quality frameworks that align with regional standards and facilitate cross-border trade. Pre-Export Verification of Conformity programs operated by SGS ensure compliance with technical regulations and standards, reducing trade barriers and customs delay. Informal trade networks continue to operate alongside formal channels, creating parallel market structures that affect price discovery and revenue collection.
Regulatory Landscape
Uganda's grain market is shaped by government policy, standards enforcement, and procurement rules that focus on quality and food safety. The Ministry of Trade, Industry and Cooperatives leads implementation of the National Grain Trade Policy (2015), while the Ministry of Agriculture, Animal Industry and Fisheries (MAAIF) oversees production-side quality assurance. The Uganda National Bureau of Standards (UNBS) is the primary authority for national standards for grain quality, measurement, and safety, supported by enforcement tools under the UNBS (Market Surveillance and Enforcement of Compulsory Standard Specifications) Regulations, 2021, including seizure of non-conforming commodities.
Regulatory tightening has raised the commercial value of certification and traceability for grain traded domestically and across borders. Public procurement requirements have been used to formalize demand, with government entities directed to procure grain from UNBS-certified suppliers effective August 23, 2024, and primary and secondary schools following in January 2025 under the PPDA Act (Cap 205) framework. Alongside this, the Grain Council of Uganda's Grain Industry Self-Regulation (ISR) guidelines, and UNBS training with the Eastern Africa Grain Council on testing and grading, reinforce compliance pathways aimed at reducing aflatoxin-related rejections and improving access for regional and international buyers.
Value Chain Analysis
Uganda's grains value chain runs from input supply (seed, fertilizer, crop protection, mechanization, and extension) through predominantly smallholder production, aggregation by traders and cooperatives, and then storage, trading, processing, and distribution into domestic food channels and regional cross-border markets. Access to finance increasingly links upstream and midstream actors, with government-supported facilities such as the Agricultural Credit Facility (ACF) and Uganda Development Bank (UDB) contributing to an agricultural loan portfolio of Shs 1,699 billion by FY2023/24. Warehouse-receipt models and digital exchanges also help improve price discovery and working-capital cycles for participants that can meet grading and quality requirements.
Midstream infrastructure remains the key driver of quality and losses. By FY2023/24, grain storage capacity reached 1,236,219 MT, while post-harvest grain losses fell from 37% (2017/18) to 18.2% (FY2022/23), but gaps persist in rural aggregation, drying, and certified storage coverage, keeping seasonal distress selling common. Downstream, Uganda has more than 2,263 agro processing facilities (APFs), with grain milling and food and feed processing expanding, while cereals remain the largest agricultural import category. In 2024, imports were valued at over USD 250 million, largely rice and wheat, underscoring processing and supply-gap bottlenecks that continue to pull in imports even as domestic production capacity rises.
Market Opportunities and Future Outlook
Formalization of quality compliance is creating investable opportunities across storage, testing, grading, and certified handling. UNBS moved to mandatory certification for grain traded in and out of Uganda during 2025, including Q-Mark compliance and SPS permitting to address aflatoxin-driven rejections, followed by a December 2025 notice on compulsory standard specifications for commodities. This shift strengthens demand for accredited inspection and laboratory services, certified warehouses, moisture management, and traceable aggregation models, supporting service providers and processors that can institutionalize compliance for both public procurement and cross-border buyers.
Capital programs and export-oriented planning are also shaping where growth initiatives concentrate along the chain. MOFPED launched a Shs 176 billion Large Scale Commercial Farmers Facility (January 2025) to subsidize production of priority crops including maize, sorghum, and beans, implemented through Pride Microfinance, Post Bank, and Housing Finance Bank. In 2026, MOFPED framed the Tenfold Growth Strategy with a stronger push for agro-industrial exports and value-added manufacturing, and MOFPED reported disbursement of Shs 3.78 trillion through the Parish Revolving Fund to 3.7 million beneficiaries (April 2026), supporting on-farm investment for staples used in food and feed value chains. Alongside feasibility work on national grain storage reserves (including planning references such as Jinja, Lira, Hoima, and Moroto), these programs create clear entry points for storage developers, feed manufacturers, and structured buyers building certified offtake and financing loops with farmers.
Recent Industry Developments
- June 2026: The African Development Bank Group approved a USD 140 million Uganda Multipurpose Water for Climate Resilient Irrigation Development and Agro-Industrialization Programme, combining irrigation expansion with agro-industrialization enablers. The program design links water infrastructure to aggregation, storage, and processing outcomes, supporting more reliable grain supply and improved raw-material quality for millers and feed producers.
- June 2025: Uganda National Bureau of Standards initiated mandatory certification for grain traded in and out of Uganda, requiring Q-Mark compliance and SPS permitting to curb aflatoxin contamination and export rejections. This raises the baseline for market participation and increases demand for certified handling, testing, and traceable procurement across traders, warehouses, and processors.
- November 2024: Export Trading Group secured a USD 394 million loan facility from FMO and Trade and Development Bank to expand agricultural operations across Africa, including investments across Uganda's grain value chains. The financing supports scale-up in storage and farmer support services, strengthening formal aggregation and improving the reliability of supply into domestic processors and regional export channels.


Research Methodology Framework and Report Scope
Market Definition and Coverage
For this methodology, the Uganda grains market is defined as the value generated from domestically produced and traded staple grains sold into food and feed use across Uganda, expressed in USD, with demand and supply tracked through production, consumption, imports, exports, and prices.
Scope exclusions: We exclude oilseeds, pulses, processed grain products (such as flour and ready-to-eat items), and on-farm subsistence that is not marketed.
Segmentation Overview
- By Grain Type (Production Analysis (Volume), Consumption Analysis (Volume and Value), Import Analysis (Volume and Value), Export Analysis (Volume and Value), and Price Trend Analysis)
- Maize
- Millet
- Sorghum
- Rice
Data Validation & Update Cycle
Outputs are checked through triangulation across volume signals, trade direction, and price ranges, and then reviewed for outliers that can come from one-off shocks like export restrictions or localized drought. We compare the modeled value against independent indicators such as cereal CPI direction, reported production changes, and trade balance shifts, and then investigate variance before sign-off.
Reports are refreshed annually, and interim updates are made when material events change the operating environment, such as policy actions that affect cross-border flows or sharp currency movement that impacts USD conversion. Before delivery, an analyst performs a fresh pass on the latest public releases and re-contacts sources when assumptions move outside agreed ranges, so the final view reflects the most current inputs.
Mordor Intelligence's Uganda Grains Market Size Compared Against Other Published Estimates
Published estimates for Uganda grains often do not match because they refresh at different times, convert to USD using different currency windows, and treat price realization differently across harvest and lean seasons. Differences also show up when informal trade is treated as fully priced like formal channels, which can inflate value if quality and certification discounts are not applied.
A refresh-led check is especially important here because the timing of farmgate-to-wholesale price movement, and when those prices are averaged into an annual ASP, can shift the headline number even if volumes are similar. By revalidating seasonal ASP assumptions and the USD conversion timing close to the update cycle, Mordor Intelligence keeps the estimate tied to what is likely traded and realized in-market during the stated year.
Benchmark comparison
| Source | Market Size | Gaps in Research Methodology |
|---|---|---|
| Mordor Intelligence | USD 2.27 B (2026) | |
| Global Consultancy A | USD 4.27 B (2024) | Uses an earlier base year and appears to apply a broader valuation lens with less visible checks on seasonal price realization and informal-to-formal price discounts, which can lift the USD value even when tonnage trends are comparable. |
| Industry Publisher B | USD 4.63 B (2025) | Likely includes a wider grain basket and a different ASP build, where annual pricing may be smoothed without separating harvest and lean month spreads, and where USD conversion timing can differ from the in-year trading pattern. |
Taken together, the spread is mostly explained by how the priced basket is defined and how annual ASP and FX timing are handled, rather than by a single demand shock. Our approach stays transparent because each step is traceable to volumes, trade flows, and seasonality checks that can be repeated and reviewed.


Key Questions Answered in the Report
What is the current value of the Uganda grains market?
The Uganda grains market size is valued at USD 2.27 billion in 2026.
How fast is the market projected to grow?
It is forecast to reach USD 3.35 billion by 2031, reflecting a 8.12% CAGR.
Which grain holds the largest share?
Maize leads with 45.40% of the Uganda grains market share in 2025.
Which grain is growing the fastest?
Rice posts the highest growth, expanding at an 8.55% CAGR through 2031.
What are the main factors driving growth?
Government input subsidies, regional animal-feed demand, warehouse-receipt finance and digital produce exchanges are key drivers.
Page last updated on:






