
Market Overview
| Study Period | 2021 - 2031 |
|---|---|
| Market Size (2026) | USD 149.96 Billion |
| Market Size (2031) | USD 178.11 Billion |
| Growth Rate (2026 - 2031) | 3.50% CAGR |
| Fastest Growing Market | Asia Pacific |
| Largest Market | North America |
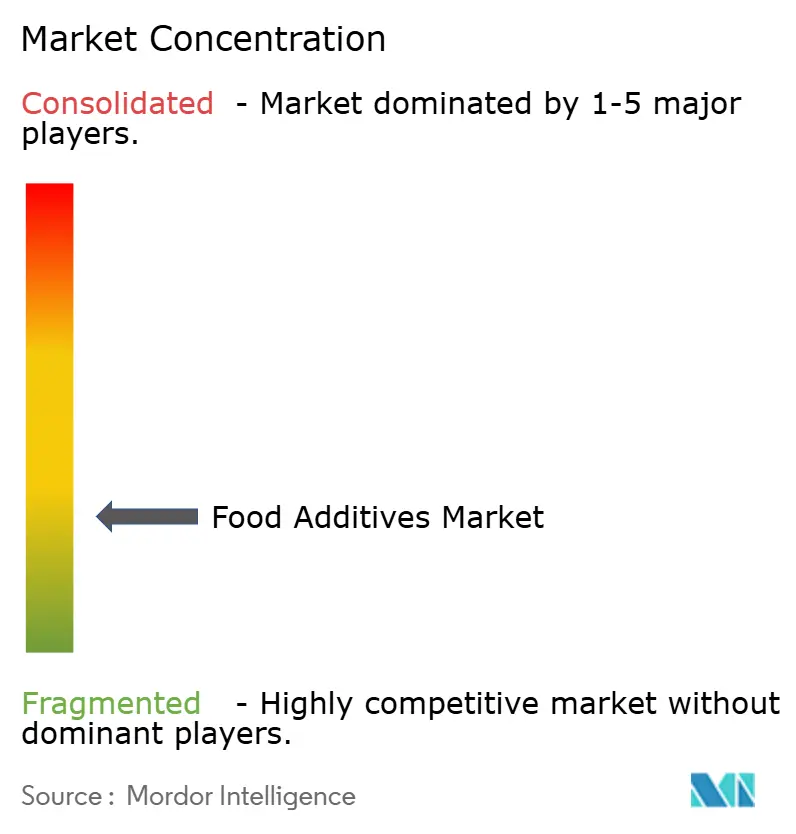
| Market Concentration | Low |
Major Players
*Disclaimer: Major Players sorted in no particular order Image © Mordor Intelligence. Reuse requires attribution under CC BY 4.0. |
|
Food Additives Market Analysis by Mordor Intelligence
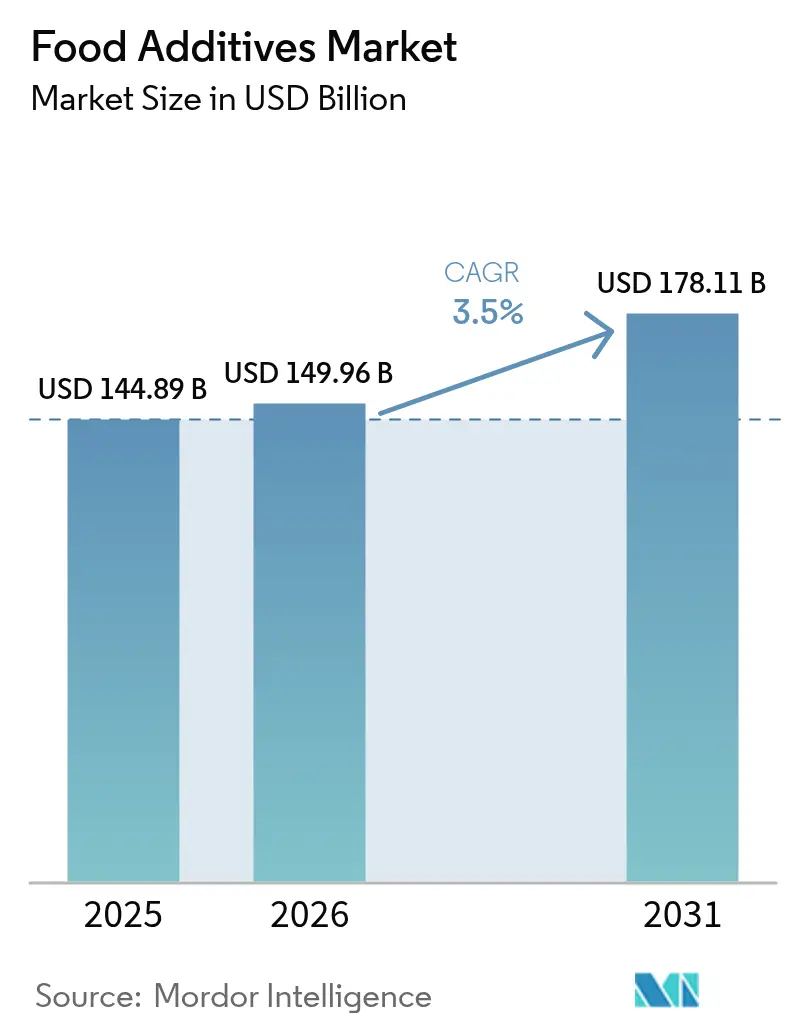
The global food additives market size is expected to grow from USD 144.89 billion in 2025 to USD 149.96 billion in 2026 and is forecast to reach USD 178.11 billion by 2031 at 3.5% CAGR over 2026-2031. This measured growth reflects the industry's maturation and the complex interplay between consumer demand for natural ingredients and the technical requirements of modern food processing. The market's trajectory indicates a fundamental shift from volume-driven expansion to value-oriented innovation, where manufacturers prioritize ingredient functionality and consumer acceptance over pure cost optimization. The industry is witnessing a substantial shift towards clean-label ingredients and natural food additives, reflecting evolving consumer preferences and regulatory requirements. Manufacturers are increasingly focusing on developing additives that can be labeled as GMO-free, natural preservatives, or organic, driving significant market growth in natural alternatives. This trend is particularly evident in categories such as colorants, acidulants, and hydrocolloids.
Key Report Takeaways
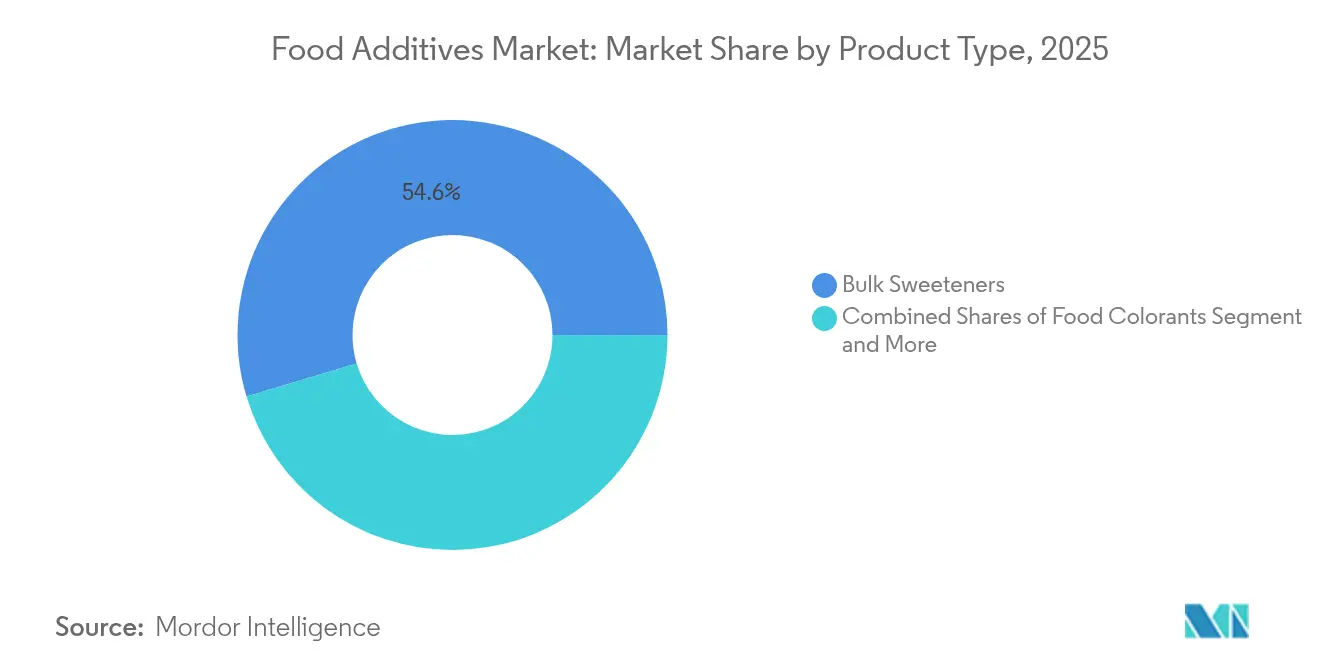
- By product type, bulk sweeteners captured 54.62% of the food additives market share in 2025, and food colorants are projected to clock the fastest 6.65% CAGR.
- By form, dry additives commanded 62.95% share of the food additives market in 2025, while liquid additives are expected to expand at a 5.95% CAGR from 2026-2031.
- By source, synthetic ingredients held 66.10% of the 2025 market share; natural additives will grow at a 5.25% CAGR to 2031.
- By application, bakery & confectionery led with 26.12% share in 2025; dairy & desserts are anticipated to advance at a 5.05% CAGR through 2031.
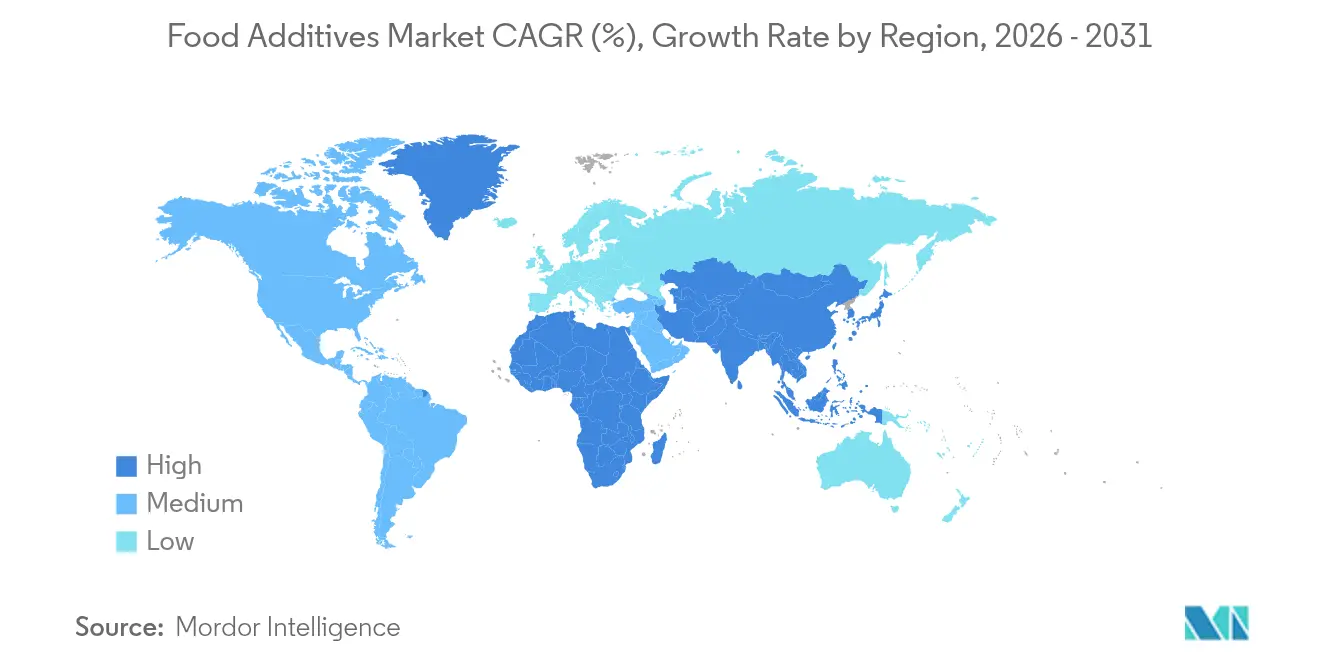
- By geography, North America accounted for 30.98% of 2025 revenue, whereas Asia-Pacific is projected to register the fastest 4.45% CAGR over the forecast period.
Note: Market size and forecast figures in this report are generated using Mordor Intelligence’s proprietary estimation framework, updated with the latest available data and insights as of 2026.
Global Food Additives Market Trends and Insights
Drivers Impact Analysis*
| Driver | (~) % Impact on CAGR Forecast | Geographic Relevance | Impact Timeline |
|---|---|---|---|
| Rising Demand for Processed and Convenience Food | +1.2% | Global, with strongest impact in Asia-Pacific and Latin America | Medium term (2-4 years) |
| Increasing Demand for Natural and Clean Label Products | +0.8% | North America & EU, expanding to Asia-Pacific | Long term (≥ 4 years) |
| Enhanced Shelf Life and Preservation Needs | +0.6% | Global, particularly emerging markets with limited cold chain | Short term (≤ 2 years) |
| Technological Advancements in Food Processing | +0.5% | North America, EU, and developed Asia-Pacific markets | Long term (≥ 4 years) |
| Growing Demand for Fortified and Functional Beverages | +0.3% | Global, led by health-conscious demographics | Medium term (2-4 years) |
| Evolving Consumer Preference for Taste and Texture | +0.2% | Developed markets with premium food segments | Medium term (2-4 years) |
| Source: Mordor Intelligence | |||


Rising Demand for Processed and Convenience Food
With the rise in urbanization and a growing middle-class population, the developed and developing regions across the globe are witnessing a rising demand for processed and packaged food, leading to more demand for food additives across the globe. The consumption of processed products like bakery, confectionery, and beverages is increasing among consumers due to product innovation and product attractiveness. Young consumers and the working population are opting to consume processed beverages like cold drinks, energy drinks, and others. Consumers are driven by the improved texture, flavor, and overall sensory experience of ready meals and processed food products, hence promoting the demand for food additives, artificial ingredients, sugar, and preservatives, among others. A report by the World Health Organization (WHO) and the Indian Council for Research on International Economic Relations (ICRIER)[1] Indian Council for Research on International Economic Relations, "Rise in the Consumption of Ultra-Processed Foods in India", www.icrier.org.in 2023 revealed that the sale of ultra-processed foods has witnessed a rapid rise in India over the duration of 10 years. These ultra-processed foods contain sugar and fat for longer shelf-life, artificial colors and flavors, and artificial sweeteners, and with the increase in the consumption of ready-to-eat meals and sugary drinks across the country, is likely to support the demand for food additives in coming years as well.
Increasing Demand for Natural and Clean Label Products
The demand for recognizable ingredients has transformed product development, as manufacturers shift toward natural alternatives instead of synthetic additives. This change requires comprehensive reformulation strategies to maintain product functionality while ensuring ingredient transparency. Companies must reevaluate their entire production processes, from sourcing raw materials to adjusting manufacturing parameters. Plant-based and microbial preservatives are emerging as viable options, with companies such as Galactic developing solutions that extend shelf life and ensure food safety while meeting regulatory requirements. These natural preservatives undergo extensive testing to validate their efficacy across different food matrices and storage conditions. The clean label trend has created opportunities for biotechnology firms to produce fermentation-based ingredients that fulfill both natural and functional requirements, establishing them as premium substitutes for synthetic additives. These fermentation processes are optimized to yield consistent, high-quality ingredients that can effectively replace traditional chemical preservatives while maintaining product stability and safety.
Enhanced Shelf Life and Preservation Needs
Supply chain complexities and food security concerns have increased the demand for preservation technologies, especially in regions lacking cold storage infrastructure. The absence of proper storage facilities in many developing markets has made preservation solutions crucial for maintaining food quality and reducing spoilage. Food waste, recognized as both an economic and environmental issue, drives investments in preservation solutions that extend product shelf life while maintaining safety and quality. Current preservation methods emphasize additives that combine antimicrobial protection with additional benefits, including nutritional enhancement and improved sensory attributes. These additives serve multiple purposes, from preventing bacterial growth to enriching products with vitamins and minerals. The market players are launching new preservatives in the market to cater to the rising demand for preservatives. For instance, in March 2025, Corbion introduced Verdad Essence WH100, a cultured wheat solution that inhibits mold growth in baked goods. This clean-label ingredient maintains the product's taste, texture, and shelf life while providing natural preservation properties. This integration allows for continuous tracking of food freshness, temperature variations, and potential contamination throughout the supply chain.
Technological Advancements in Food Processing
Food processing technology innovations are driving significant advancements in additive applications through precision fermentation and biotechnology. Technologies like precision fermentation utilize engineered microorganisms to produce proteins traditionally derived from animals, improving food formulation capabilities and addressing critical sustainability concerns in the food industry. Enzyme engineering techniques provide manufacturers with customized solutions for specific food processes, although bioengineered enzymes continue to face challenges related to production scalability and regulatory acceptance. High isostatic pressure and high-pressure homogenization technologies enhance enzyme activity and stability under mild conditions, enabling manufacturers to optimize ingredient performance while maintaining consistent product quality. These technological advances facilitate the development of sophisticated multifunctional additive systems that effectively reduce ingredient complexity while simultaneously improving cost-effectiveness and ensuring regulatory compliance across various food applications.
Restraints Impact Analysis*
| Restraint | (~) % Impact on CAGR Forecast | Geographic Relevance | Impact Timeline |
|---|---|---|---|
| Stringent Regulatory Frameworks | -0.4% | Global, with highest impact in EU and North America | Long term (≥ 4 years) |
| High R&D and Innovation Costs | -0.3% | Developed markets with advanced regulatory requirements | Medium term (2-4 years) |
| Labeling Challenges and Transparency Pressures | -0.2% | North America & EU, expanding globally | Short term (≤ 2 years) |
| The Adverse Effects of Food Additives | -0.1% | Global, with heightened awareness in developed markets | Medium term (2-4 years) |
| Source: Mordor Intelligence | |||
Stringent Regulatory Frameworks
Regulatory complexity affects market participants through divergent approval processes across jurisdictions, creating barriers to global product launches and increasing compliance costs. Companies must navigate various regulatory frameworks, documentation requirements, and safety standards in each market in which they operate. The FDA's revocation of authorization for erythrosine (Red No. 3) in foods demonstrates the heightened scrutiny of food additives, requiring companies to maintain comprehensive safety databases and regulatory expertise. Companies must continuously monitor regulatory changes, update their compliance protocols, and invest in scientific research to support product safety claims. State-level regulations, including California's ban on specific chemical additives in schools, have created multiple compliance requirements that affect product formulation and market entry strategies. These varying requirements necessitate region-specific product modifications and separate supply chain management systems. This regulatory environment increases operational costs and complexity while constraining additive development innovation, as companies must allocate significant resources to compliance rather than research and development initiatives.
High Research and Development and Innovation Costs
The development of next-generation food additives demands significant investment in research capabilities, regulatory compliance studies, and manufacturing infrastructure, which creates entry barriers for smaller companies and constrains innovation. The global food enzyme market demonstrates growth potential; however, developing and commercializing new enzyme solutions requires extensive technical expertise, financial resources, and specialized equipment. Companies transitioning to natural and biotechnology-derived ingredients face higher development costs than those producing traditional synthetic alternatives due to investments in new production methods, comprehensive safety studies, and quality control systems. These substantial development costs restrict innovation rates and provide competitive advantages to established companies with adequate resources for long-term research programs, advanced laboratory facilities, and skilled scientific personnel. The high capital requirements also affect market dynamics by limiting the number of new entrants and concentrating innovation capabilities among larger industry players with established research and development infrastructure.
*Our forecasts treat driver/restraint impacts as directional, not additive. The impact forecasts reflect baseline growth, mix effects, and variable interactions.
Segment Analysis
By Product Type: Bulk Sweeteners Dominate While Colorants Lead Innovation
Bulk sweeteners hold a 54.62% market share in 2025, serving as essential ingredients in food and beverage formulations across baked goods and processed foods. Food colorants are experiencing the highest growth rate with a 6.65% CAGR during 2026-2031, driven by increasing consumer preference for visually appealing products and the shift from synthetic to natural alternatives. These colorants maintain established safety standards through scientific validation and defined acceptable daily intake levels. Preservatives continue to show consistent demand due to food safety requirements and extended supply chains that necessitate antimicrobial protection. Emulsifiers are growing in importance due to the expansion of plant-based and convenience foods that require advanced texture control.
Natural colorants are gaining market value as consumers increasingly prefer products without synthetic chemicals, despite higher costs and processing challenges. Enzymes demonstrate strong growth potential in the product portfolio. Anti-caking agents and acidulants perform specific functions in powder and processed food applications, with silicon dioxide and calcium phosphate serving as commonly approved anti-caking agents across food categories. Hydrocolloids are becoming increasingly important for texture modification, particularly as manufacturers develop improved mouthfeel and stability in reduced-fat and plant-based products.


By Form: Dry Additives Lead Market Share Despite Liquid Growth
Dry form additives hold 62.95% market share in 2025, due to their superior storage stability, transportation efficiency, and ease of handling in industrial food processing operations. Liquid additives show a growth rate of 5.95% CAGR during 2026-2031, driven by applications requiring precise dosing, immediate solubility, and integration into liquid food systems. The dominance of dry additives stems from practical manufacturing considerations, as powder forms provide extended shelf life, lower shipping costs, and simplified inventory management compared to liquid variants. Anti-caking solutions maintain powder flowability by reducing moisture-induced caking, with calcium carbonate solutions demonstrating potential for reduction in caking under severe conditions.
Liquid additives see increased adoption in beverage applications and specialized food processing, where immediate dispersion and uniform distribution are essential for product quality. The expansion of functional beverages and liquid nutritional products increases demand for liquid additive forms that integrate effectively without impacting taste, appearance, or stability. Emulsifiers such as lecithin play a vital role in combining water and oil-based ingredients, maintaining textural uniformity across products from infant formulas to baked goods and spreads. Advances in encapsulation and controlled-release systems allow dry additives to achieve liquid-like performance while retaining the handling benefits of powder forms, resulting in hybrid solutions that balance functionality and operational efficiency.
By Source: Synthetic Dominance Challenged by Natural Growth
Synthetic additives hold a 66.10% market share in 2025, due to their cost-effectiveness, consistent performance, and established regulatory approval across global markets. Natural additives are projected to grow at a 5.25% CAGR during 2026-2031, driven by increasing consumer demand for recognizable ingredients and supportive regulatory trends. The synthetic segment maintains its position through optimized manufacturing processes, quality control, and proven functional performance across food applications. While synthetic food colors offer cost and stability advantages over natural alternatives, they raise health concerns, including potential mutations and allergic reactions.
Natural additives require advanced extraction methods and stabilization techniques to match synthetic alternatives' performance. The growing consumer preference for clean-label food ingredients has increased bio-preservative demand, with research identifying plant, animal, and microbial metabolites as potential sources. While natural ingredients involve higher raw material costs and complex supply chains, they enable premium pricing and differentiation in health-conscious markets. Natural thickening and gelling agents, particularly algae-derived hydrocolloids like carrageenan, agar, and alginate, are gaining market acceptance despite ongoing safety discussions in certain applications.

By Application: Bakery Leadership Meets Dairy Innovation
Bakery and confectionery applications hold a 26.12% market share in 2025, due to the high concentration of additives required for various functional purposes, from texture enhancement to shelf-life extension. The bakery segment's prominence stems from complex additive requirements necessary for achieving specific texture, volume, and preservation in baked goods, with emulsifiers, enzymes, and preservatives being essential for product quality. Mono and diglycerides serve as primary emulsifiers in ice cream and baked goods, stabilizing food products and extending shelf life, with FDA Generally Recognized as Safe (GRAS) status.
Dairy and desserts represent the fastest-growing application segment with a 5.05% CAGR during 2026-2031, supported by developments in plant-based alternatives and functional dairy products. Beverages offer substantial growth potential, especially in functional and fortified categories where additives enable nutritional enhancement and flavor optimization. The increased demand for fortified and functional beverages creates opportunities for specialized additive formulations that provide health benefits while maintaining product stability. Meat and meat products utilize additives for preservation and texture enhancement, while the plant-based meat segment requires advanced additive systems to achieve traditional meat characteristics. Soups, sauces, and dressings incorporate emulsifiers and stabilizers to maintain consistency and shelf stability, with clean label preferences increasing demand for natural thickening agents and preservation systems.
Geography Analysis
North America holds 30.98% market share in 2025, driven by advanced food processing infrastructure, comprehensive safety standards, and consumer acceptance of premium additive solutions. The region's established regulatory framework facilitates product development while encouraging innovation in natural and functional ingredients. The FDA's increased post-market evaluation of food chemicals demonstrates the region's safety commitment, though this may restrict new synthetic additive entries. North American food manufacturers focus on clean label formulations, exemplified by Cargill's high-intensity sweeteners portfolio, including EverSweet®, Truvia®, and ViaTech®. The region's expertise in biotechnology and precision fermentation enables advanced additive development, despite market entry challenges from high costs and regulatory requirements.
Asia-Pacific shows the highest growth rate at 4.45% CAGR during 2026-2031, supported by urbanization, middle-class expansion, and increased processed food consumption. China's National Health Commission's approval of 30 new food additives in 2024 indicates strong regulatory support in the region's primary market. Japan's food processing sector, valued at USD 190 billion, reflects regional trends toward pre-prepared foods and enhanced safety standards. The region benefits from manufacturing efficiencies and raw material availability, making it a strategic production hub for domestic and international markets.
Europe maintains market distinction through strict regulations, natural ingredient preferences, and sustainable food production practices. The European Commission's support for bio-based innovations, including various fermentation technologies, reinforces the region's sustainable additive development. EU-wide regulatory alignment offers market access benefits, despite rigorous compliance standards. The region's focus on organic and natural products creates opportunities for additives meeting both functional requirements and sustainability standards.

Regulatory Landscape
Food additive regulation is largely structured as positive list systems that specify permitted substances, conditions of use, and labeling requirements, which adds substantial compliance work for firms scaling across markets. In the European Union, Regulation (EC) No 1333/2008 (Food Improvement Agents Package) anchors approvals and use limits, alongside EFSA re-evaluations of existing additives. One example is the sucralose (E 955) re-evaluation completed in February 2026, which found no safety concern at current uses while examining proposed use extensions.
Regulatory scrutiny is also continuing to reshape colorants and other high-visibility ingredient classes. In the United States, the FDA issued final orders in February 2026 to amend color additive regulations for expanded use of spirulina extract and beetroot red in human foods, and broader post-market monitoring has increased the need to maintain safety dossiers. In the United Kingdom, the Food Standards Agency moved in April 2025 to an electronic register as the official public list of authorized food additives, shifting authorizations away from statutory-instrument driven listings and changing how firms track and document in-market compliance.
Value Chain Analysis
The food additives value chain begins with upstream feedstocks (agricultural inputs such as corn and sugar crops, vegetable oils, seaweed and plant biomass for hydrocolloids, and petrochemical or mineral inputs for many synthetic additives) and proceeds through extraction, fermentation or bioprocessing, chemical synthesis, blending, and formulation. Because many additives are governed through permitted-use lists, development and commercialization typically run alongside a regulatory workstream that covers safety substantiation, specifications, and use-level validation, with guidance from the FDA, the European Commission under Regulation (EC) No 1333/2008, and international standards referenced in Codex Alimentarius.
Midstream manufacturing and downstream distribution are further shaped by quality systems, traceability, and application support provided to food and beverage manufacturers across bakery and confectionery, dairy and desserts, beverages, meat, and sauces. Global logistics is also a risk variable for additives and intermediates. Disruption around major shipping corridors has been cited as adding 10-14 days of transit time when rerouting via the Cape of Good Hope, while also lifting container freight costs (about USD 600-1,200 per TEU), which supports the trend toward regional sourcing, strategic inventory, and multi-node supply networks. Standards-setting activity can also affect commercialization cadence, with JECFA holding its 100th meeting in June 2025 to evaluate multiple additives, and Codex Committee on Food Additives (CCFA) convening its 56th session in April 2026.
Competitive Landscape
The food additives market maintains a concentration level of 3 out of 10. This structure allows both large multinational corporations and specialized companies to compete effectively through distinct positioning approaches. The market leaders benefit from their global presence in research and development, regulatory compliance capabilities, and extensive distribution networks. These advantages enable them to maintain quality standards, develop innovative solutions, and ensure consistent product delivery worldwide. Smaller companies succeed by targeting specific applications and new technologies, often demonstrating greater agility in responding to local market needs and emerging consumer preferences.
Market opportunities exist in precision fermentation technologies, plant-based additive alternatives, and multifunctional ingredients that address multiple consumer needs. The precision fermentation segment focuses on producing sustainable protein alternatives and bioactive compounds. Plant-based alternatives cater to the growing demand for natural and clean-label products. The industry adoption of technology includes artificial intelligence for ingredient optimization, blockchain for supply chain transparency, and advanced fermentation systems for sustainable production.
These technological implementations help companies improve production efficiency, ensure product quality, and meet regulatory requirements. The European Commission's recent approval of the Firmenich International SA and Koninklijke DSM N.V. merger demonstrates ongoing market consolidation in the flavors and vitamins segments, while maintaining competitive market dynamics through moderate combined market shares. This consolidation reflects the industry's evolution toward integrated solutions and enhanced operational capabilities.
Food Additives Industry Leaders
-
Cargill, Incorporated
-
Archer Daniels Midland Company
-
BASF SE
-
Tate & Lyle Plc
-
International Flavors and Fragrances Inc.
- *Disclaimer: Major Players sorted in no particular order

Market Opportunities and Future Outlook
Regulatory-driven reformulation and specification tightening are creating room for suppliers that can offer compliant, clean-label, and functionally equivalent alternatives for high-scrutiny applications. In January 2026, the European Commission adopted Regulation (EU) 2026/196, tightening purity specifications and lowering maximum use levels for several additives (including locust bean gum, guar gum, and xanthan gum) in products for vulnerable populations and infant formulae. This raises demand for higher-purity inputs, stronger supplier documentation, and reformulation support across stabilizer and hydrocolloid systems.
Post-market assessment programs and related global standards work are also changing how portfolios are prioritized and defended, with an emphasis on generating safety and exposure evidence and providing substitution paths when needed. In May 2026, the FDA launched a post-market food chemical safety assessment program starting with reviews of butylated hydroxytoluene (BHT) and azodicarbonamide (ADA), and public comment runs through July 13, 2026. The process is increasing near-term attention on preservative and processing-aid alternatives and on label-friendly oxidative stability solutions. In parallel, Codex CCFA56 advanced draft additive provisions toward final adoption, and an updated GSFA is targeted for publication in the second half of 2026, supporting opportunities for suppliers that align formulations to internationally referenced standards for multi-market scalability.
Recent Industry Developments
- June 2026: Ingredion acquired NutriLeads' prebiotic fiber business, Benicaros, built on upcycled carrot pomace. The move strengthens Ingredion's position in specialty, value-added fibers and aligns portfolio expansion with clean-label and circularity-linked ingredient demand.
- September 2025: BASF finalized the sale of its global Food and Health Performance Ingredients business to Louis Dreyfus Company (LDC). This divestment reshapes competitive dynamics in nutritional ingredients and changes how customers access certain emulsifiers and related solutions through a new owner and go-to-market structure.
- June 2024: Azelis signed a distribution agreement with BASF to distribute BASF's emulsifiers, MCT, phytosterol ester, and CLA portfolio for food and nutrition applications. The agreement broadened route-to-market coverage for BASF ingredients and strengthened Azelis' offering in bakery, beverages, and nutrition-focused formulations.


Research Methodology Framework and Report Scope
Market Definition and Coverage
For this methodology, the food additives market covers ingredients added to packaged or processed foods to improve or maintain safety, shelf life, taste, texture, or appearance, and it is measured as the value of additives sold into food and beverage use.
Scope exclusions: We exclude on-farm primary commodities and finished retail food sales values, even when products make additive content claims.
Segmentation Overview
-
By Product Type
- Preservatives
- Bulk Sweeteners
- Sugar Substitutes
- Emulsifiers
- Anti-Caking Agents
- Enzymes
- Hydrocolloids
- Food Flavors and Enhancers
- Food Colorants
- Acidulants
-
By Form
- Dry
- Liquid
-
By Source
- Natural
- Synthetic
-
By Application
- Bakery and Confectionery
- Dairy and Desserts
- Beverages
- Meat and Meat Products
- Soups, Sauces, and Dressings
- Other Applications
-
By Geography
-
North America
- United States
- Canada
- Mexico
- Rest of North America
-
Europe
- United Kingdom
- Germany
- Spain
- France
- Italy
- Russia
- Rest of Europe
-
Asia-Pacific
- China
- India
- Japan
- Australia
- Rest of Asia-Pacific
-
South America
- Brazil
- Argentina
- Rest of South America
-
Middle East and Africa
- Saudi Arabia
- South Africa
- Rest of Middle East and Africa
-
North America
Data Validation & Update Cycle
Outputs are validated by comparing the implied additive spend against independent signals such as regional processed food output, trade flows for key ingredient families, and observed price ranges from interviews and public disclosures. If a region or application shows an abnormal swing, the drivers are re-checked, and if the variance cannot be explained cleanly, we re-contact sources.
Before sign-off, the model and the narrative go through multi-step analyst review so the scope, units, and assumptions stay consistent across sections. Reports are refreshed annually, and interim updates are made when material events occur, such as major regulatory changes, sharp raw material price moves, or supply disruptions. Right before delivery, a final pass is completed so clients receive the most current view available.
Mordor Intelligence's Global Food Additives Market Market Estimate Compared With Other Published Estimates
Published market numbers for food additives often vary because each publisher chooses a different scope, year, and pricing basis, and then applies their own assumptions about adoption and product mix. In this study, we keep the logic traceable to observable food production and usage patterns, and then we confirm the key inputs with industry feedback.
The biggest gap usually comes from whether processing aids and broader ingredient categories are counted inside the same total, and then how pricing is handled across natural versus synthetic and dry versus liquid formats. In Mordor Intelligence's model, processing aids are not counted unless they are sold and labeled as additives for a defined food and beverage use, which can pull the total away from estimates that bundle adjacent ingredient classes.
Benchmark comparison
| Source | Market Size | Gaps in Research Methodology |
|---|---|---|
| Mordor Intelligence | USD 149.96 B (2026) | |
| Global Research Publisher A | USD 120.50 B (2024) | Uses a different base year and appears to apply a faster growth curve, and its scope commonly blends some processing aids and broader ingredient buckets, which shifts the starting value and the mix-weighted ASP. |
| Industry Report Publisher B | USD 124.20 B (2024) | Reports an earlier-year size and may rely more on category-level revenue aggregation with higher long-term growth expectations, with limited clarity on currency timing and how natural versus synthetic pricing is normalized across regions. |
The spread across sources is mainly explained by year alignment and what gets included when adjacent ingredient classes sit close to additives in procurement. By keeping the inputs tied to food output, treat-rate adoption, and realistic pricing checks, the estimate stays easier to reproduce and to reconcile across regions and applications.


Key Questions Answered in the Report
What is the current size of the food additives market in 2026?
The food additives market size reached USD 149.96 billion in 2026 and is forecast to hit USD 178.11 billion by 2031.
Which product category dominates revenue?
Bulk sweeteners held 54.62% food additives market share in 2025, reflecting their indispensable role in beverages, bakery, and confectionery.
Which region is growing the fastest?
Asia-Pacific is projected to record a 4.45% CAGR from 2026-2031, driven by urban diets and regulatory approvals for new ingredients.
What technologies are shaping new product development?
Precision fermentation, enzyme engineering, and AI-driven formulation tools are enabling cleaner labels, multifunctional additives, and lower environmental footprints within the food additives market.
Page last updated on:






