
Market Overview
| Study Period | 2020 - 2031 |
|---|---|
| Market Size (2026) | USD 169.53 Billion |
| Market Size (2031) | USD 225.26 Billion |
| Growth Rate (2026 - 2031) | 5.85% CAGR |
| Fastest Growing Market | Asia Pacific |
| Largest Market | Asia-Pacific |
| Market Concentration | Low |
Major Players *Disclaimer: Major Players sorted in no particular order Image © Mordor Intelligence. Reuse requires attribution under CC BY 4.0. | |
Air Freight Market Analysis by Mordor Intelligence
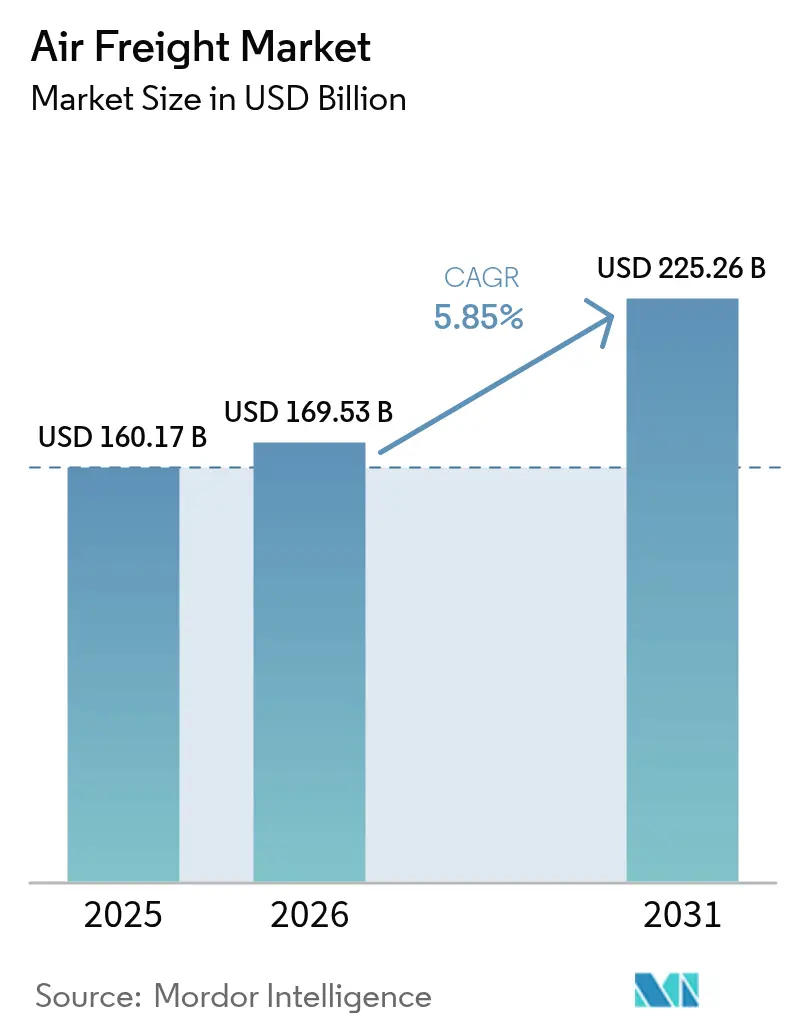
The Air Freight Market size was valued at USD 160.17 billion in 2025 and estimated to grow from USD 169.53 billion in 2026 to reach USD 225.26 billion by 2031, at a CAGR of 5.85% during the forecast period (2026-2031).
Rising cross-border e-commerce volumes, ongoing supply-chain reconfiguration, and pharmaceutical cold-chain needs are the primary forces behind this expansion. Airlines are rebalancing capacity toward specialized cargo, while passenger-to-freighter conversions support additional lift. Regulatory momentum on sustainable aviation fuel and dynamic pricing adoption is reshaping cost structures, yet overall demand remains resilient. Consolidation among forwarders and integrators indicates that scale, network depth, and technology are critical to sustaining competitive advantage in the air freight market.
Key Report Takeaways
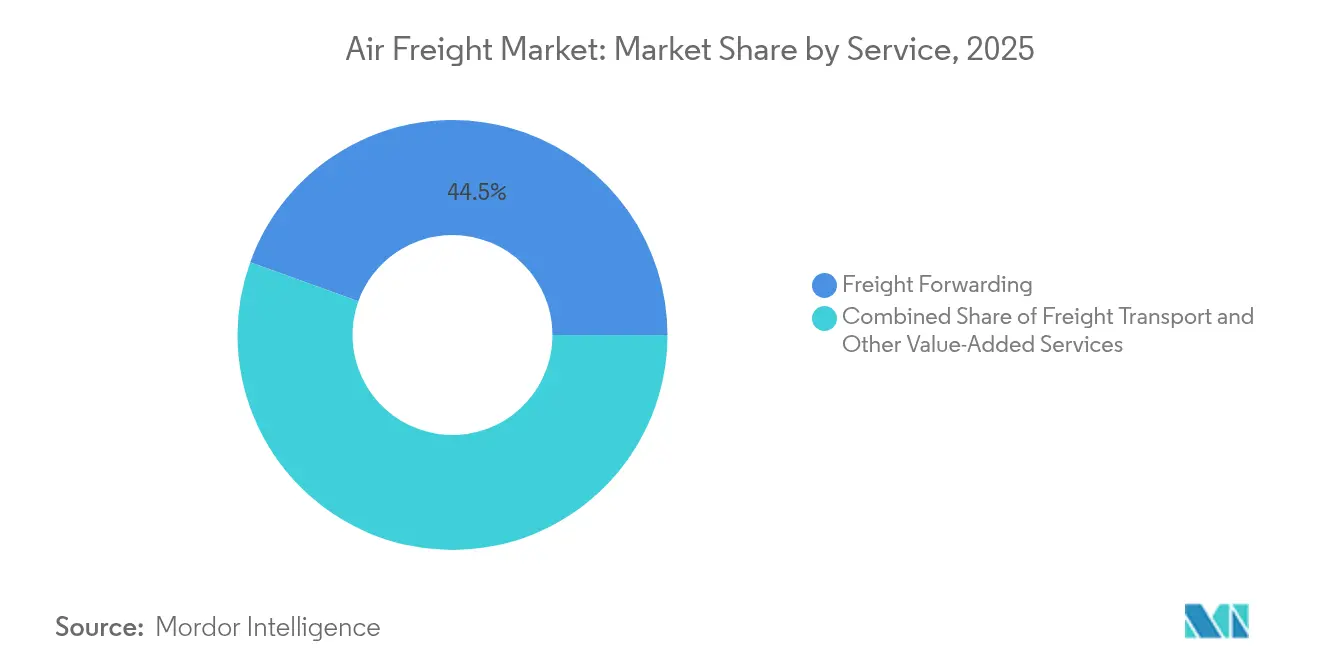
- By service, Freight Transport is set to capture 5.02% CAGR growth through 2031, while Freight Forwarding held 44.50% of the 2025 air freight market size.
- By destination, Domestic traffic is projected at 5.43% CAGR to 2031, although International service controlled 83.50% of 2025 volume within the air freight market.
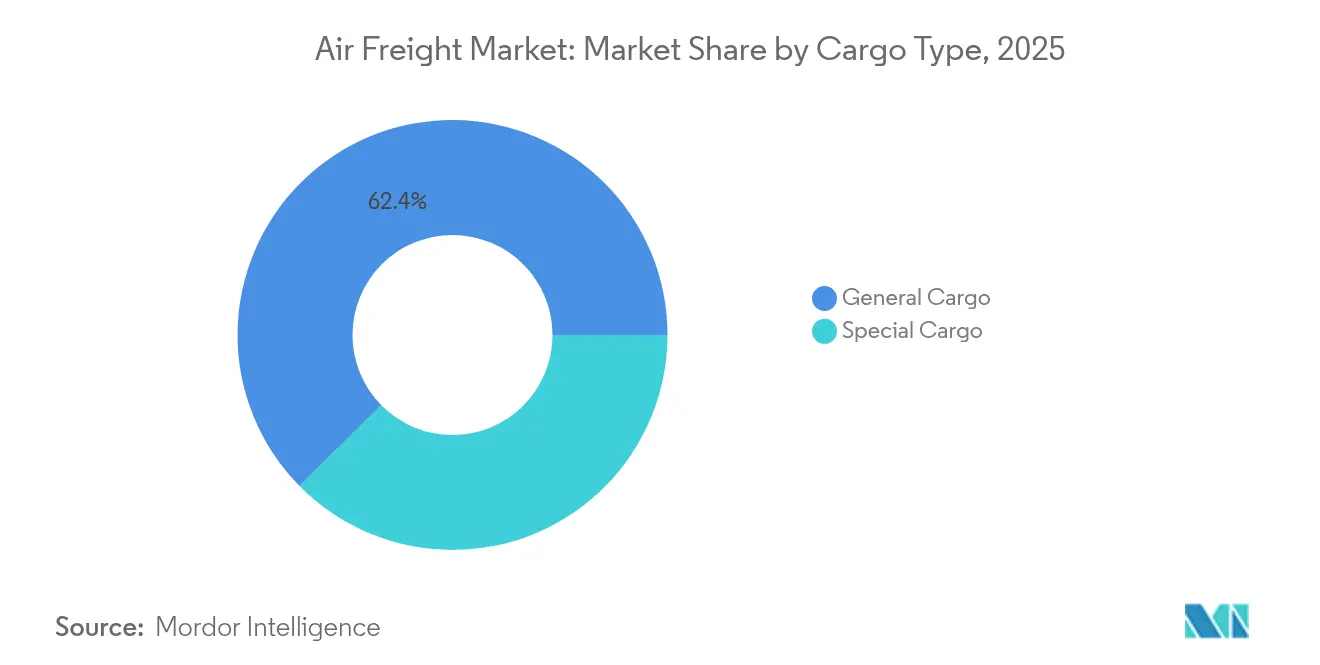
- By cargo type, Special Cargo is increasing at a 4.73% CAGR to 2031, whereas General Cargo held 62.40% of the 2025 air freight market size.
- By end-user, Manufacturing & Automotive owned 28.70% of the air freight market share in 2025, but E-commerce & Retail shows a 5.22% CAGR to 2031.
- By geography, Asia-Pacific accounted for a 40.70% air freight market share in 2025 and is advancing at a 5.72% CAGR through 2031.
Note: Market size and forecast figures in this report are generated using Mordor Intelligence’s proprietary estimation framework, updated with the latest available data and insights as of 2026.
Global Air Freight Market Trends and Insights
Drivers Impact Analysis*
| Driver | (~) % Impact on CAGR Forecast | Geographic Relevance | Impact Timeline |
|---|---|---|---|
| Expanding cross-border e-commerce shipments | +1.8% | Global, with concentration in Asia-Pacific to North America corridors | Medium term (2-4 years) |
| Accelerated supply-chain needs for high-tech electronics | +1.2% | Asia-Pacific core, spill-over to North America & Europe | Short term (≤ 2 years) |
| Global pharmaceutical cold-chain demand | +0.9% | Global, with emphasis on temperature-controlled routes | Long term (≥ 4 years) |
| Resumption of trade & near-shoring urgency | +1.1% | North America & Latin America, secondary impact in Europe | Medium term (2-4 years) |
| Cargo-dedicated narrow-body conversions | +0.7% | Global, with focus on intra-regional routes | Medium term (2-4 years) |
| AI-driven dynamic pricing adoption | +0.5% | Global, led by major carriers in developed markets | Long term (≥ 4 years) |
| Source: Mordor Intelligence | |||


Expanding Cross-Border E-Commerce Shipments
Cross-border online retail is accelerating smaller, more frequent shipments that favor air freight’s speed advantage. Airlines are reconfiguring belly capacity and scheduling extra freighter frequencies to support marketplaces that promise three-to-five-day delivery. New trans-Pacific routes connecting production zones in Asia with fulfillment centers in Mexico and the United States have emerged, deepening network density and boosting load factors. Streamlined customs processes and electronic documentation shorten clearance times, protecting service reliability. Continuous retail promotion cycles create highly volatile but generally upward-trending demand that underpins the growth of the air freight market[1]Boeing Company, “World Air Cargo Forecast,” boeing.com.
Accelerated Supply-Chain Needs for High-Tech Electronics
Semiconductor producers in Southeast Asia and Mexico now fly critical components to final assembly lines to support just-in-time manufacturing. Payloads often contain high-value microchips whose weight-to-value ratio justifies premium air charges. Airlines have introduced specialized handling protocols that mitigate static, vibration, and humidity risks, protecting product integrity. Near-shoring from China to Mexico creates shorter, higher-frequency lanes that reshape hub structures and favor narrow-body aircraft conversions. These dynamics reinforce the strategic role of the air freight market in electronics supply continuity[2]Emirates SkyCargo, “Emirates SkyCargo Orders 5 Boeing 777Fs,” skycargo.com.
Global Pharmaceutical Cold-Chain Demand
Personalized medicines, biologics, and vaccines require strict 2 °C-8 °C temperature ranges throughout transit. Carriers certified under IATA’s CEIV Pharma scheme invest in thermal blankets, active containers, and real-time monitoring that command premium yields. Regulatory oversight by the U.S. FDA and the European Medicines Agency enforces traceability, fostering long-term contractual relationships with shippers. The steady nature of health-care demand cushions revenue cycles, providing a predictable base load for freighter operations and strengthening the outlook for the air freight market[3]Japan Airlines, “International Fare Fuel Surcharge,” jal.co.jp.
Resumption of Trade & Near-Shoring Urgency
North American brands moving production closer to end markets now rely on U.S.–Mexico air corridors to move intermediate goods quickly. Bidirectional flows support balanced aircraft utilization, which reduces repositioning costs. Mexican investment incentives and logistics-friendly regulations amplify hub development at airports such as Querétaro and Monterrey. These routes shorten transit times versus Asia and underpin the domestic leg of regional supply chains, thus enlarging the customer base for the air freight market.
Restraints Impact Analysis*
| Restraint | (~) % Impact on CAGR Forecast | Geographic Relevance | Impact Timeline |
|---|---|---|---|
| Volatile fuel prices & surcharges | -1.4% | Global, with higher impact on long-haul routes | Short term (≤ 2 years) |
| Aviation-emission regulations | -0.8% | Europe & North America, expanding globally | Long term (≥ 4 years) |
| Airport slot constraints at secondary hubs | -0.6% | North America & Europe, emerging in Asia-Pacific | Medium term (2-4 years) |
| Shortage of certified ground-handling labour | -0.7% | Global, acute in developed markets | Medium term (2-4 years) |
| Source: Mordor Intelligence | |||
Volatile Fuel Prices & Surcharges
Jet fuel accounts for more than 25% of operating costs. Airlines publish monthly surcharge tables pegged to spot kerosene prices, transferring volatility to shippers. Sustainable aviation fuel blends, mandated in the EU from 2025, cost two to three times traditional Jet-A-1 and add further upward pressure. Some carriers introduce route-specific “green” fees to recover incremental expenses, which can erode price-sensitive demand. Effective fuel hedging and energy-efficient fleet renewal are vital to protecting margins in the air freight market[4]Deutsche Lufthansa AG, “Environmental Surcharge FAQ,” lufthansa.com.
Aviation-Emission Regulations
CORSIA, the EU Emissions Trading System, and national net-zero pledges compel carriers to cap or offset carbon output. Operators of older freighters face higher compliance costs, accelerating retirements, and tightening capacity. Investments in new-generation freighters with 20% lower fuel burn mitigate cost exposure but require substantial capital. Sustainability surcharges raise shipper prices, potentially diverting low-yield cargo to ocean transport and dampening certain routes within the air freight market.
*Our forecasts treat driver/restraint impacts as directional, not additive. The impact forecasts reflect baseline growth, mix effects, and variable interactions.
Segment Analysis
By Service: Forwarding Influence Amid Transport Momentum
Freight Forwarding 44.50% of 2025 revenue, reflecting complex multi-modal coordination needs, though its growth pace lags the broader air freight market at 3.74%. Many forwarders now offer digital booking portals and customs engines that deepen client retention. The Freight Transport sub-segment, covering dedicated cargo flights and courier-express-parcel lift, is growing at a 5.02% CAGR, outpacing forwarding as shippers seek direct carrier relationships. Market entrants leveraging asset-light virtual airlines and block-space agreements chip away at incumbent share, yet full-service forwarders maintain relevance through value-added visibility and insurance.
Digitalization blurs historic boundaries: integrated carriers expand brokerage desks, while forwarders charter freighters during capacity crunches. Larger shippers demand end-to-end control, pushing providers toward vertical integration. These shifts encourage competitive differentiation in technology, network reach, and specialized handling that underpins the sustained expansion of the air freight market.


By Destination: International Scale versus Domestic Velocity
International traffic represented 83.50% of 2025 tonnage, benefiting from global trade flows and wide-body aircraft economics. Long-haul lanes from Asia-Pacific to North America and Europe generate high load factors and premium yields. However, domestic air freight’s 5.43% CAGR exceeds international growth as regionalization drives short-haul replenishment between near-shored factories and consumption centers. E-commerce same-day and next-day promises accelerate dedicated domestic freighter networks, particularly in China, India, and the United States.
Regulatory simplicity, predictable schedules, and rising express parcel penetration support domestic lanes. Airlines redeploy older narrow-body conversions to shuttle goods between secondary cities, improving aircraft utilization. The complementary nature of these flows supports balanced fleet strategies and cushions macro-volatility, reinforcing the broad-based health of the air freight market.
By Carrier Type: Freighter Dominance with Belly Resurgence
Freighter aircraft delivered 55.60% of 2025 lift and remain indispensable for oversized, hazardous, or temperature-controlled cargo. Operators value main-deck loading flexibility and route independence from passenger schedules. Yet as global RPKs recover, belly capacity expands, leading to a 4.22% CAGR for this segment through 2031. Network airlines monetize spare hold space via sophisticated revenue-management tools that integrate passenger and cargo yields, raising overall profitability.
Passenger-to-freighter conversions provide cost-effective lift tailored to e-commerce density on mid-haul routes. Over 50% of projected freighter demand until 2043 stems from such conversions, especially A321-P2F and 737-800BCF variants. Balancing pure-cargo fleets with belly networks diversifies risk, sustaining route economics across the air freight market.
By Cargo Type: General Volume Meets Special Premium
General Cargo, comprising consumer goods and industrial parts, still accounts for 62.40% of tonnage, though its growth trails niche segments. Rate competition is intense, and modal shift to ocean or rail occurs when yields spike. Special Cargo-pharmaceuticals, high-tech, perishables, and dangerous goods-advances at 4.73% CAGR, commanding rates 1.5-2.5 times higher than general. Investments in CEIV certification, dedicated cool-chains, and lithium-battery safe rooms differentiate carriers and yield sticky contracts.
Tighter regulations, such as IATA DGR updates on battery handling, raise compliance costs but strengthen entry barriers. Specialized infrastructure and skilled staff improve quality assurance, enhancing carrier reputation and elevating overall service standards in the air freight market.
By End-User Industry: Manufacturing Leadership and E-Commerce Surge
Manufacturing & Automotive sustained a 28.70% revenue share in 2025 due to just-in-time parts flows and high downtime penalties. Carmakers rely on expedited air bridges for critical components during supply disruptions, ensuring assembly-line continuity. E-commerce & Retail exhibits the quickest 5.22% CAGR on the back of direct-to-consumer shipping models that prioritize transit speed over cost. Retailers integrate cross-border air corridors into omnichannel strategies, widening product availability and customer reach.
High-Tech & Electronics, Healthcare & Pharma, and Perishables contribute diversified premium volumes. Each segment demands specialized protocols that deliver above-average yields. Collectively, they enhance cargo mix resilience, stabilizing revenue for operators in the air freight market.
Geography Analysis
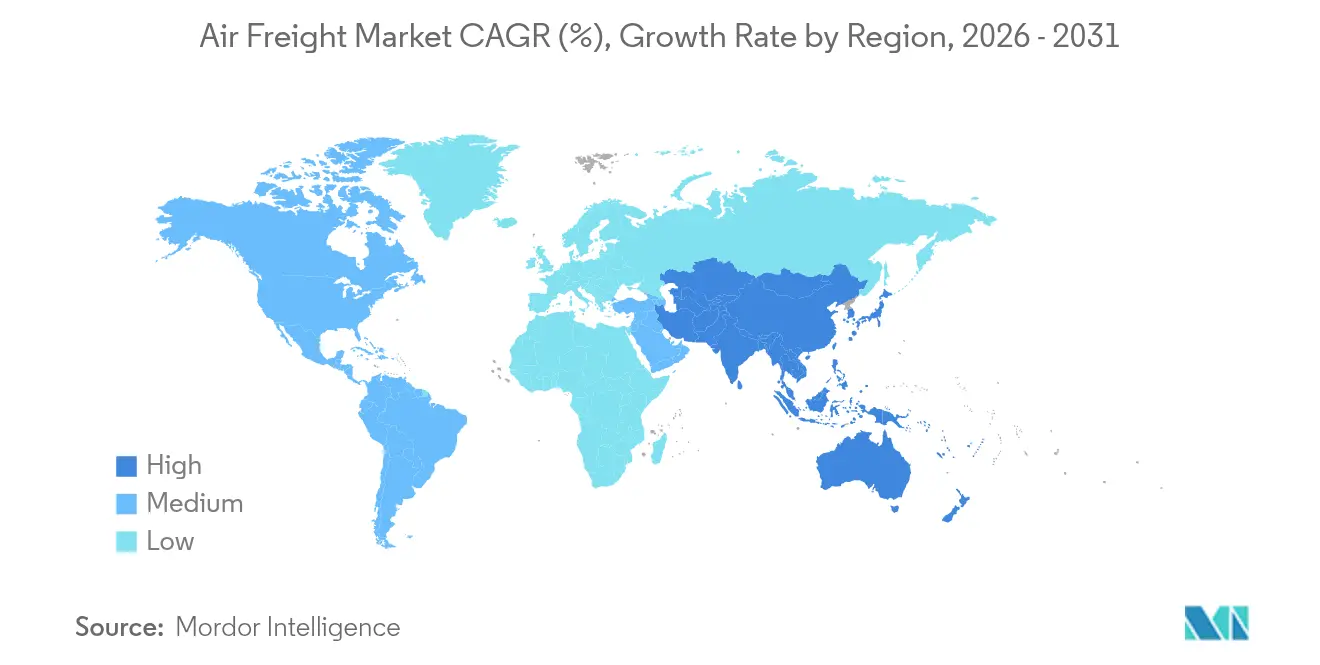
Asia-Pacific dominated 2025 with 40.70% revenue and is expected to post a 5.72% CAGR (2026-2031), reflecting dense manufacturing ecosystems, rapid consumer spending growth, and expanding intra-regional express networks. Strategic hubs in Singapore, Hong Kong, and Incheon interlink secondary production centers, boosting connectivity and network redundancy. Government incentives for near-term capacity growth at Indian and Southeast Asian airports further elevate regional significance.
North America is a significant contributor, supported by resilient domestic parcel demand and Mexico-driven near-shoring. United States regulatory relief on slot usage amid staffing shortages safeguards service continuity at major gateways. Bilateral trade levels underpin balanced CTKs, enhancing structural utilization and supporting the long-term health of the air freight market.
Europe and the Middle East present contrasting outlooks. European carriers face cost pressure from carbon compliance but benefit from a high-value export mix and strong pharmaceutical flows. Middle Eastern hubs exploit geographic proximity among three continents, achieving robust transshipment traffic. Africa and South America remain smaller yet demonstrate opportunity in resource-driven demand and growing e-commerce penetration.

Regulatory Landscape
Air freight operations are governed by global safety standards, together with country-level security and trade compliance. Dangerous goods rules are anchored in ICAO Technical Instructions (Doc 9284), with the 2025-2026 edition incorporating updates affecting battery shipments, and IATA issued Addendum 1 to the 67th Edition of the Dangerous Goods Regulations effective January 1, 2026, tightening provisions and documentation expectations for shippers, forwarders, handlers, and carriers.
On the trade and security side, the United States advanced inbound cargo pre-screening through U.S. Customs and Border Protection (CBP) Enhanced Air Cargo Advance Screening (ACAS): an interim final rule effective November 2025 added data transmission elements and set a one-year informed compliance period. In parallel, U.S. tariff and trade-policy instruments continued to evolve in 2026, including HTSUS Chapter 99 modifications effective February 24, 2026, and a July 2026 White House proclamation on imports of commercial aircraft and engine parts tied to national security considerations. These steps raise compliance-management intensity for cross-border air cargo flows and aviation-related supply chains.
Value Chain Analysis
The air freight value chain begins with shipment origination and packaging by shippers, then proceeds through first-mile trucking, airport cargo acceptance, security screening, and terminal handling, including build-up into ULDs. It continues with line-haul air transport using freighter main-deck capacity or passenger belly space. Freight forwarders and integrators operate at the orchestration layer, aggregating volumes, arranging capacity via spot bookings or block-space agreements, and managing customs and security filings. Increasingly, they also provide digital booking, tracking, and exception management, while ground handlers, airports, and specialized container providers support execution for special cargo (pharma, perishables, DG).
Capacity and service performance are shaped by operational constraints and network design. Labor shortages at major hubs and disruption-driven modal shifts have increased the use of time-definite air freight for high-value and time-sensitive goods, while airspace and routing constraints add planning complexity and cost. Industry consolidation in forwarding, illustrated by DSV completing the acquisition of DB Schenker in April 2025, is reinforcing scale advantages in procurement, customs capability, and end-to-end control. Carriers and handlers are also investing in automation and data standards to reduce paper-based frictions across borders.
Competitive Landscape
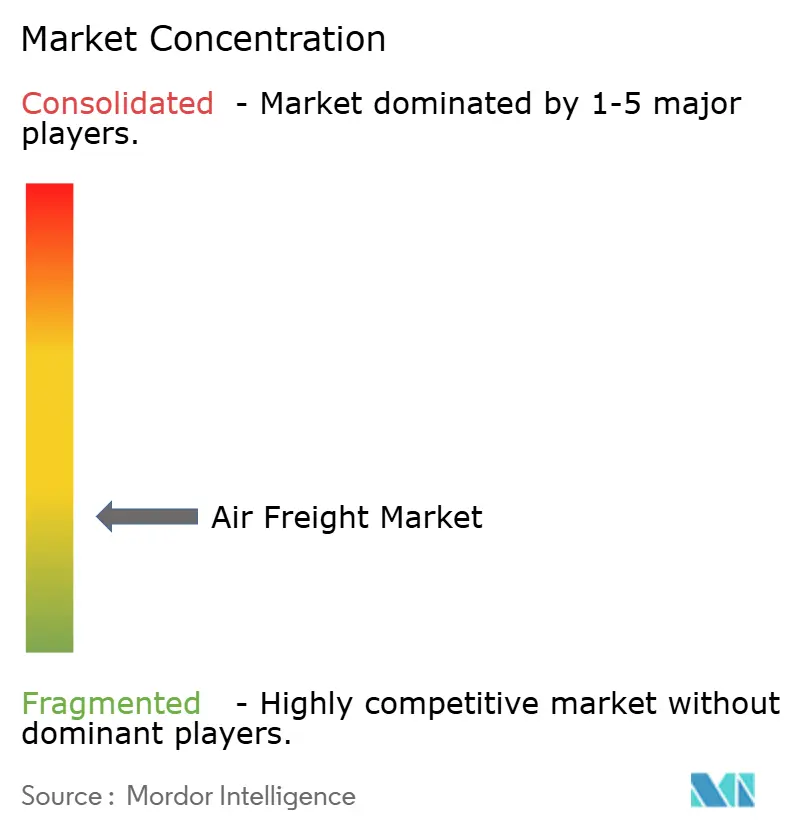
Market concentration is fragmented. FedEx leads cargo CTKs, while Qatar Airways, UPS, and Emirates maintain sizable shares with diversified fleets. DSV’s acquisition of DB Schenker consolidates forwarding power, foreshadowing intensified scale competition. Integrated partnerships such as Air France-KLM and CMA CGM blend air and ocean strengths, offering multimodal solutions that appeal to global shippers.
Technology serves as a key differentiator. Delta trials generative AI pricing; Cathay deploys autonomous ground tractors; Emirates invests in hydrogen-powered trucks to decarbonize first-and-last-mile legs. Labor retention and sustainability investment emerge as strategic priorities. Operators capable of integrating digital platforms, green initiatives, and robust human-capital strategies are best positioned to capture future gains within the air freight market.
Air Freight Industry Leaders
FedEx Corporation
Emirates SkyCargo
Qatar Airways Cargo
Delta Cargo
Cathay Pacific Cargo
- *Disclaimer: Major Players sorted in no particular order

Market Opportunities and Future Outlook
Opportunities are concentrating around (i) airport and cargo-terminal modernization that improves throughput and reliability for special cargo and e-commerce flows, and (ii) data standardization that reduces friction in booking, compliance, and shipment visibility. Capacity-led whitespace is visible in major hub buildouts and upgrades, including Lufthansa Cargo advancing its Frankfurt hub modernization through the first phase of its LCCevo project (ALPHA), featuring an automated high-bay warehouse. Dubai Airports announced that contracts totaling AED 55 billion are to be awarded by end-2026 for the Al Maktoum International Airport expansion, with a stated air-cargo handling ambition of 12 million tonnes annually by 2032.
In Asia, Turkish Airlines broke ground on a USD 2.3 billion cargo investment at Istanbul Airport, including SmartIST Phase 2 with a stated target capacity of 4.5 million tonnes annually. Clark International Airport moved into planning for a 30-hectare integrated cargo city, expanding the addressable market for handling and logistics services around secondary gateways. Digitization is also shifting from fragmented interfaces toward shared data rails, creating room for forwarders, handlers, and carriers to operationalize interoperable shipment information. In 2026, IATA positioned ONE Record as the preferred standard for member cargo data exchange, supporting more consistent data sharing across booking, acceptance, screening, and delivery milestones. This aligns with premium-cargo mix changes highlighted in the report context, where shippers prioritize traceability, exception response, and compliance-ready documentation, supporting demand for CEIV-aligned processes, automated terminals, and digitally integrated cross-border workflows.
Recent Industry Developments
- June 2026: Emirates SkyCargo expanded its freighter services across East and Southeast Asia, including increased frequencies to Hong Kong and new thrice-weekly freighter flights from Zhengzhou to Dubai. It strengthens connectivity from manufacturing and e-commerce origins into a major Middle East hub, and adds dedicated lift for time-sensitive and special cargo lanes.
- April 2026: Emirates SkyCargo started scheduled freighter operations at Liege Airport with five weekly Boeing 777F flights, marking a new freighter destination in 2026. Establishing a regular Liege service deepens access to a key European cargo gateway and improves routing options for express, pharma, and cross-border e-commerce shipments.
- July 2024: Emirates SkyCargo ordered five Boeing 777 freighters for delivery in 2025-2026, targeting a material increase in main-deck capacity. The fleet addition supports network expansion and helps secure lift for high-yield segments such as pharmaceuticals and high-tech cargo during capacity-tight periods.


Research Methodology Framework and Report Scope
Market Definition and Coverage
For this study, the market is defined as revenues generated from moving goods by air across domestic and international routes. This includes carrier-provided cargo capacity and freight forwarding services across all major global regions.
Scope exclusions: Passenger ticket revenue, pure warehousing without air movement, and last mile road delivery are excluded from the market value.
Segmentation Overview
- By Service
- Freight Transport (Cargo/CEP)
- Freight Forwarding
- Other Value-Added Services (Customs brokerage, insurance, etc.)
- By Destination
- Domestic
- International
- By Carrier Type
- Belly Cargo
- Freighter
- By Cargo Type
- General Cargo
- Special Cargo
- By End-User Industry
- E-commerce & Retail
- Manufacturing & Automotive
- Healthcare & Pharmaceuticals
- Perishables & Fresh Produce
- High-Tech & Electronics
- Others
- By Geography
- North America
- United States
- Canada
- Mexico
- South America
- Brazil
- Peru
- Chile
- Argentina
- Rest of South America
- Asia-Pacific
- India
- China
- Japan
- Australia
- South Korea
- South East Asia (Singapore, Malaysia, Thailand, Indonesia, Vietnam, and Philippines)
- Rest of Asia-Pacific
- Europe
- United Kingdom
- Germany
- France
- Spain
- Italy
- BENELUX (Belgium, Netherlands, and Luxembourg)
- NORDICS (Denmark, Finland, Iceland, Norway, and Sweden)
- Rest of Europe
- Middle East and Africa
- United Arab of Emirates
- Saudi Arabia
- South Africa
- Nigeria
- Rest of Middle East And Africa
- North America
Data Validation & Update Cycle
Before finalizing, outputs are triangulated against independent signals such as airport throughput releases, trade series movements, and carrier commentary. Any unusual spikes are reviewed until the driver is clearly explained. We also run variance checks across regions and service types so totals do not drift away from known network constraints.
A second analyst review is completed before sign-off, and sources are rechecked if assumptions do not reconcile. Reports are refreshed annually, and interim updates are made when material events occur, such as major capacity shocks, regulatory changes, or sharp pricing swings. Right before delivery, a fresh review pass is completed so clients receive the most current view available.
Mordor Intelligence's Global Air Freight Market Estimate Compared With Other Published Estimates
Published market sizes for air freight can look far apart even when the topic sounds the same, because the counting boundary is not always consistent. The biggest differences usually come from what revenue streams are included, how international versus domestic activity is valued, and whether the estimate is anchored to observed capacity and yield signals.
Freight ton-kilometers, airport cargo throughput, and carrier cargo revenue disclosures are the checks that keep Mordor Intelligence's estimate tied to air transport activity, instead of blending in broader logistics services that sit outside air movement. Other gaps can come from using different base years, applying aggressive pricing escalation without matching it to yield trends, or converting currencies using different averaging windows, which can shift the reported USD value for the same year.
Benchmark comparison
| Source | Market Size | Gaps in Research Methodology |
|---|---|---|
| Mordor Intelligence | USD 169.53 B (2026) | |
| Global Consultancy A | USD 332.03 B (2024) | This figure appears to use a wider service boundary, where express and other related services are bundled in a way that can overlap with non-air logistics revenue. It is also anchored to a different base year. |
| Industry Publisher B | USD 172.74 B (2024) | This estimate is for air cargo, but it can differ based on whether it counts airline-only cargo revenue versus combined forwarding and carrier value, along with base-year choice and how fuel surcharges and yield changes are treated. |
The spread in published values is largely explained by scope boundaries and the year used for the headline number, not by a disagreement that air freight is growing. When the model is pinned to observable throughput and capacity signals, and then checked against revenue and pricing direction, the final total stays transparent and repeatable for decision-making.


Key Questions Answered in the Report
How big is the air freight market in 2026?
The air freight market size stands at USD 169.53 billion in 2026 with a 5.85% CAGR to 2031.
Which region holds the largest share of global air cargo?
Asia-Pacific leads with 40.70% revenue in 2025 and maintains the fastest 5.72% CAGR through 2031.
What drives the fastest growth within domestic air cargo?
Near-shoring and e-commerce fulfillment boost domestic routes, resulting in a 5.43% CAGR through 2031.
How are carriers coping with stricter emission rules?
Airlines invest in fuel-efficient jets, sustainable aviation fuel, and environmental surcharges to manage compliance costs.
Why are passenger-to-freighter conversions important?
Conversions supply cost-effective capacity tailored to mid-haul e-commerce lanes and are projected to cover over half of future freighter demand.
Page last updated on:




