
Europe Olive Market Analysis by Mordor Intelligence
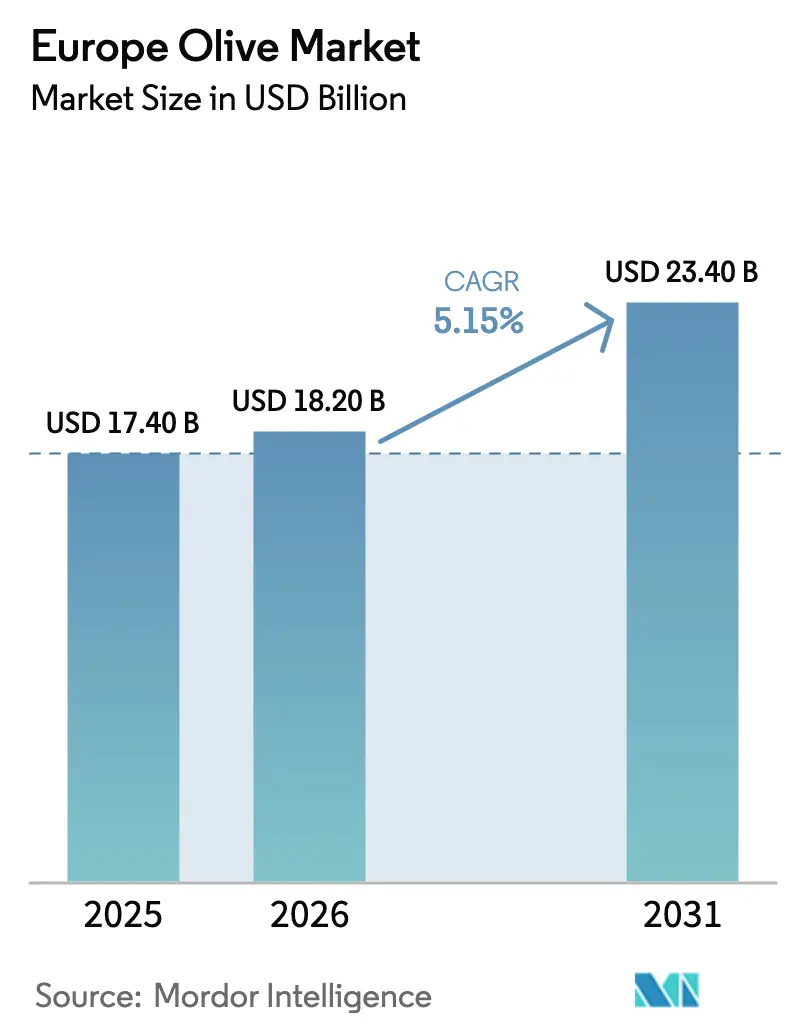
The Europe olive market size is expected to grow from USD 17.40 billion in 2025 to USD 18.2 billion in 2026 and is forecast to reach USD 23.4 billion by 2031 at a 5.15% CAGR over 2026-2031. Strong retail premiums for organic and Protected Designation of Origin (PDO) oils, mechanization gains from super-high-density orchards, and supportive Common Agricultural Policy (CAP) payments underpin this expansion. Spain accounts for nearly three-fifths of regional output, while Portugal's rapid orchard conversions and Germany's rising per-capita consumption are reshaping production and consumption growth patterns. Tight harvests in Spain during 2024, caused by extreme heat, led to an increase in extra-virgin olive oil spot prices per kilogram in early 2025. This prompted retailers to secure longer-term contracts and invest in traceability measures. Exporters are also shifting from bulk to branded formats to capture margins and comply with the European Union's deforestation and sustainability rules, which came into force in 2025.
Key Report Takeaways
- By geography, Italy accounted for a 24.8% share of the Europe olive market size in 2025, whereas Poland recorded the highest 7.4% CAGR through 2031.
Note: Market size and forecast figures in this report are generated using Mordor Intelligence’s proprietary estimation framework, updated with the latest available data and insights as of January 2026.
Europe Olive Market Trends and Insights
Drivers Impact Analysis*
| Driver | (~) % Impact on CAGR Forecast | Geographic Relevance | Impact Timeline |
|---|---|---|---|
| Rapid rollout of super-high-density plantations | +0.9% | Spain, Portugal, Italy, and Greece | Long term (≥ 4 years) |
| Mediterranean diet adoption boosts demand | +0.8% | Germany, France, the Nordics, and Poland | Medium term (2–4 years) |
| Common Agricultural Policy incentives for groves | +0.6% | Spain, Italy, Greece, and Portugal | Long term (≥ 4 years) |
| Shift Toward Organic and Protected Designation of Origin (PDO)-Certified Production | +0.5% | Italy, Greece, Portugal, and Spain | Medium term (2–4 years) |
| Valorization of olive by-products | +0.4% | Spain, Italy, and Greece | Medium term (2–4 years) |
| Surge in demand for naturally processed table olives | +0.3% | Spain, Italy, Greece, and Germany | Short term (≤ 2 years) |
| Source: Mordor Intelligence | |||
Rapid Rollout of Super-High-Density Plantations
Super-high-density plantings exceeded 185,000 hectares in Spain and Portugal by late 2025, a 28% rise from 2023 [1]Source: Spanish Ministry of Agriculture, Fisheries and Food, “Olive Sector Statistics,” mapa.gob.es. Orchard densities of 1,500–2,200 trees per hectare enable continuous harvesters to collect 95% of the fruit in one pass, thereby slashing labor costs when seasonal wages increased by more than 4.4% in Andalusia between 2024 and 2025. Earlier bearing means cash flow starts in year three instead of year seven, shortening payback periods even with European Central Bank rates near 3.5% in 2025. These systems create a monoculture risk because drip-irrigated Arbequina blocks lose up to 40% of their yield when summer soil moisture falls below 25% of field capacity, a threshold breached in 18 of the past 24 months across Andalusia.
Mediterranean Diet Adoption Boosts Demand
According to the American Heart Association, substituting 10 grams of butter with extra-virgin olive oil was associated with an 8% reduction in cardiovascular events, and Germany, France, and the United Kingdom incorporated the finding into updated dietary guidelines. Germany accounted for 13.4% of Europe olive oil imports in 2025, receiving 176,000 metric tons, a 12% increase over 2024. Poland brought in 22,000 metric tons during 2025, up 19% year-on-year, marking the fastest import growth among the bloc’s major buyers [2]Source: European Commission, “Eurostat Database,” ec.europa.eu.
Common Agricultural Policy (CAP) Incentives for Groves
The 2023–2027 Common Agricultural Policy channels EUR 1.2 billion (USD 1.4 billion) in coupled income support to olive growers, paying EUR 60–150 (USD 70.8-177.1) per hectare and helping to cushion incomes after the 2024 shortfall [3]Source: European Commission, “Common Agricultural Policy at a Glance,” agriculture.ec.europa.eu. Eco-schemes reward ground cover crops and raptor nesting boxes with an additional EUR 90 (USD 97) per hectare, a design that helped 14,000 Spanish farms adopt integrated pest control in 2025. Portugal utilized rural development funds to co-finance 38 new mills in 2024 and 2025, reducing the average grove-to-press haul to 18 kilometers and enhancing free fatty acid scores. Starting in 2027, 25% of payments will be contingent on soil-health benchmarks, making regenerative farming a central component of cash flow forecasts.
Shift Toward Organic and Protected Designation of Origin (PDO)-Certified Production
Organic olive oil accounted for the majority of European retail value in 2025, as consumers paid higher prices for premium oils than for conventional ones. Italy’s 42 Protected Designation of Origin (PDO) labels generated EUR 1.8 billion (USD 1.9 billion) in retail sales in 2025, with Kalamata Protected Designation of Origin (PDO) oil trading at EUR 12.50 (USD 13.50) per liter, double the price of generic oil. Certification requires grove geolocation, cultivar heritage, and sensory panel approval, aligning with the European Union's deforestation rules, which require traceable supply chains from January 2025. Retailers highlight Protected Designation of Origin (PDO) seals on front-of-pack icons, reinforcing shopper trust and widening price gaps in premium aisles.
Restraints Impact Analysis*
| Restraint | (~) % Impact on CAGR Forecast | Geographic Relevance | Impact Timeline |
|---|---|---|---|
| Extreme weather anomalies are lowering yields | −0.6% | Spain, Italy, Greece, Portugal, and France | Short term (≤ 2 years) |
| High volatility of international prices | −0.4% | Spain, Italy, and Greece | Medium term (2–4 years) |
| Labor shortages and rising wage costs | −0.15% | Spain, Italy, Greece, and Portugal | Medium term (2–4 years) |
| Spread of Xylella fastidiosa threatening groves | −0.15% | Italy, France, Spain, and Greece | Long term (≥ 4 years) |
| Source: Mordor Intelligence | |||
Extreme Weather Anomalies are Lowering Yields
In Europe, the 2024 harvest reached only 1.89 million metric tons, 30% below the five-year average, following 47 days with temperatures above 40 degrees Celsius in Andalusia and a 35% yield drop in Puglia due to swings in frost and drought. Soil moisture deficits compelled Greek growers to restrict irrigation, resulting in an 85,000 metric ton reduction in national output. Spot prices spiked toward EUR 9.90 (USD 10.70) per kilogram in early 2025, prompting bottlers to blend refined oils and to import from Tunisia and Turkey at higher freight costs. Climate models predict that southern Spain could lose 15% of its suitable olive-growing area by 2030, prompting growers to adopt shade netting and heat-tolerant cultivars.
Spread of Xylella Fastidiosa Threatening Groves
By 2025, the bacterium had infected 21 million olive trees in Italy’s Puglia region, cutting regional output by 28% since 2019. Containment zones in France and Spain increased compliance checks and uprooting mandates, raising grower costs and insurance premiums. Research plots with resistant Leccino cultivars show promise but require 8–10 years before full commercial yields are achieved, delaying regional recovery. The disease also threatens genetic diversity because many farmers replace mixed-variety groves with single-resistant clones, reducing resilience to future pathogens.
*Our forecasts treat driver/restraint impacts as directional, not additive. The impact forecasts reflect baseline growth, mix effects, and variable interactions.
Geography Analysis
Italy remained the largest consumer, accounting for 24.8% of European olive intake in 2025, as its deep culinary heritage and dense milling network sustain high table olive and oil consumption. Poland delivered the fastest consumption growth, advancing at a 7.1% CAGR through 2031 as rising incomes and nutrition campaigns encouraged greater household use of raw olives and fresh-pressed oils. Italy’s entrenched demand base helps stabilize regional volumes during price spikes, while Poland’s rapid uptake illustrates the expansion potential in Eastern Europe. Together, both countries now define the region’s consumption floor and its sharpest growth trajectory.
Spain continues to exhibit strong household demand, but has lost its position as the leading consumer to Italy. Its consumption share now ranks below Italy but remains higher than that of France and Germany. France relies heavily on imports and emphasizes organic and Protected Designation of Origin (PDO) lots to sustain margins, while Germany’s wellness-driven demand keeps volumes climbing, albeit more slowly than in Poland. The United Kingdom, despite Brexit-related tariffs, continues to widen foodservice use through direct Iberian supply contracts that secure consistent quality. These mid-tier consumers collectively anchor demand across Western Europe and ensure diversified market pull for Southern suppliers.
Looking ahead, Italy plans to boost demand through mill-side tourism and enhanced marketing of Protected Designation of Origin (PDO) products, whereas Poland’s retailers are investing in cold-chain logistics and educational campaigns to sustain consumer momentum. Spain, France, and Germany are introducing freshness labeling and nitrogen-flushed storage, which broaden menu applications and extend shelf life, moves that help hedge against price volatility. The United Kingdom is piloting blockchain traceability trials with major grocers, a feature that could raise consumer trust and lift premium-segment sales. Collectively, these country-level initiatives are poised to elevate overall European olive consumption and support sustained market expansion through 2031.
Regulatory Landscape
The European Union marketing standards for olive oil are anchored in Commission Delegated Regulation (EU) 2022/2104 and Commission Implementing Regulation (EU) 2022/2105, which set labeling requirements and conformity checks. In the market context of tighter sustainability and origin substantiation, traceability requirements began applying from January 2025 and are increasingly used to support compliance evidence, including alongside PDO/PGI systems.
At the international standard-setting level, Council Decision (EU) 2026/711 establishes the EU position in the International Olive Council (IOC) framework to update analytical rules, including a safer method for determining peroxide value (COI/T.20/Doc. No 38) and parameters relevant to monovarietal extra virgin olive oil. This reinforces laboratory-based quality verification alongside existing scheme protections. Control and anti-fraud scrutiny remains a regulatory pressure point: the European Court of Auditors published Special Report 01/2026 on EU olive oil control systems, keeping enforcement quality and fraud prevention on the agenda for member-state authorities and operators. Alongside EU-wide tools such as Private Storage Aid, member states also use national mechanisms to manage imbalances, illustrated by Spain's Ministerial Order 1192/2025, which establishes a mandatory withdrawal mechanism linked to national production levels. This can affect stock management and contracting behavior during volatile harvest cycles.
Value Chain Analysis
The Europe olive value chain covers upstream inputs (nursery plants, irrigation, fertilizers, and crop protection), grove management, and harvesting, which is increasingly mechanized in super-high-density systems. It also includes milling and extraction, storage and blending, bottling and packaging, and downstream distribution through retail, foodservice, and export channels. Producer organizations and cooperatives remain central in key producing countries, using operational programmes for production planning, quality improvements, and market withdrawal actions, supported by risk tools such as harvest insurance. Branded players and private-label suppliers also tighten supplier audits for origin, sustainability, and chemical compliance.
Recent supply-chain dynamics have been shaped by yield volatility and transparency initiatives. The European Commission launched the European Olive Oil and Table Olives Market Observatory in November 2024 to improve data visibility and coordination across the chain. DG Agriculture and Rural Development continued updating monthly production notifications for the 2025/2026 campaign, released in June 2026, which supports more frequent monitoring of availability and market balance. Consecutive low-yield seasons have depleted stocks and pushed prices up, increasing the importance of storage management and diversified sourcing (including imports for blending). This also elevates the value of efficient milling networks, including Portugal's mill build-out, which reduced grove-to-press distances and helped protect quality metrics.
Competitive Landscape
The top five suppliers collectively controlled a moderate share of Europe olive market revenue in 2025. Deoleo, the largest branded player, generated significant revenue in 2024. The company is scaling a Quick Response code (QR)- and blockchain-enabled traceability program with IBM Food Trust to give shoppers bottle-level origin data. Sovena anchors private-label supply through its Marmelo mill in Ferreira do Alentejo, a highly automated facility recognized for water- and energy-efficient extraction processes.
Salov, owner of Filippo Berio, leads the Long Life Oil research partnership, which is testing advanced packaging and controlled-atmosphere technologies to slow oxidation, without disclosing specific outlay figures. Borges International remains active in diversified sourcing and benefits from Tunisia’s improving harvest outlook, which is easing supply pressure across the Mediterranean value chain. Monini builds premium credentials through its flagship Classico and Delicato lines, which have carried fully offset carbon footprints since 2021. These mid-tier brands compete on sensory quality, sustainability messaging, and responsiveness to retailer audits.
Growth over the next five years will hinge on digital traceability, climate compliance, and supply-chain modernization. Deoleo’s blockchain rollout aims to cover all premium labels by mid-2026, supporting price differentiation in crowded supermarket sets. Salov’s shelf-life research should enhance export efficiency to distant markets, while Sovena’s integrated grower-mill model positions it to meet retailer scorecards on water and carbon use. Tunisia’s rebound adds raw-oil slack that Borges and Monini can leverage to improve blending strategies and overall supply resilience. As retailers tighten sustainability procurement rules, companies that pair transparent sourcing with lower environmental footprints are poised to capture incremental share.
Market Opportunities and Future Outlook
Premiumization and compliance-led differentiation continue to create room for traceable, standards-aligned products. With EU marketing standards under Regulations (EU) 2022/2104 and 2022/2105 and a 2025 traceability context, operators have a clearer pathway to monetize origin and quality verification in retail, particularly for PDO and organic segments that already command price gaps. The March 2026 Council Decision (EU) 2026/711, which backs updates in IOC analytical methods including peroxide value determination, supports investment in lab capability, digital lot tracking, and bottle-level transparency programs that brands and retailers can use to defend claims and reduce fraud exposure.
Climate volatility and input constraints are moving technology adoption toward operational use rather than pilots. This opens opportunities for Agriculture 4.0 solutions that measure water stress, automate disease risk detection, and integrate orchard sensors into decision support, as reflected in projects such as TecnOlivo, OLIVITECH, and OLIVETO-SMART. Policy-linked funding also offers a near-term activation point: Commission Implementing Regulation (EU) 2025/441 provides emergency financial support for climate-affected agricultural sectors, with member-state reporting deadlines by 31 March 2026. That timing aligns grower investment cycles with resilience upgrades such as water management, harvesting efficiency, and by-product valorization. On the demand side, import growth in non-producing EU markets, including Germany and Poland in 2025, supports distribution expansion for branded, portioned, and convenience-led formats that can better manage consumer price sensitivity while preserving usage occasions.
Recent Industry Developments
- June 2026: Van Lanschot Kempen's SDG Farmland Fund acquired a 400-hectare irrigated olive orchard in Faro do Alentejo, Portugal, to integrate into its Rio de Azeite platform. The acquisition points to rising institutional capital flows into scalable, water-secured olive production assets in Southern Europe. It also reinforces Portugal's role in orchard conversion and professionalized farm management within the regional supply base.
- April 2026: Arvos completed the acquisition of Pere Olive from Labeyrie Fine Foods, adding a specialist chilled Mediterranean table olives and antipasti business and positioning the Andenne, Belgium facility as its European hub for chilled product innovation. The deal extends Arvos' capabilities beyond ambient olive products and strengthens access to European retail channels that are expanding refrigerated Mediterranean offerings. It also signals ongoing consolidation in value-added table olive formats where differentiation is tied to recipes, freshness, and supply reliability.
- November 2024: The European Commission launched the Market Observatory for Olive Oil and Table Olives in Brussels to improve data transparency and expert cooperation across the supply chain. More frequent and comparable market information supports better-timed contracting, inventory decisions, and policy responses during supply shocks. The platform also strengthens traceability and compliance readiness as retailers and regulators increase scrutiny on origin and labeling accuracy.


Research Methodology Framework and Report Scope
Market Definition and Coverage
The Europe olive market is defined as the value generated from olives traded and consumed across European countries, captured at wholesale level and expressed in USD. We treat market value as the product of olive volumes moving through the market and the average realized prices for those volumes.
Scope exclusions: Farm equipment, retail markups, and downstream processed foods where olive is a minor ingredient are excluded from this sizing.
Segmentation Overview
- By Geography
- Spain
- Production Analysis (Area Harvested, Yield, and Production Volume)
- Consumption Analysis (Consumption Value and Volume)
- Import Market Analysis (Import Value, Volume, and Key Supplying Markets)
- Export Market Analysis (Export Value, Volume, and Key Destination Markets)
- Wholesale Price Trend Analysis and Forecast
- Regulatory Framework
- List of Key Players
- Logistics and Infrastructure
- Seasonality Analysis
- Italy
- Production Analysis (Area Harvested, Yield, and Production Volume)
- Consumption Analysis (Consumption Value and Volume)
- Import Market Analysis (Import Value, Volume, and Key Supplying Markets)
- Export Market Analysis (Export Value, Volume, and Key Destination Markets)
- Wholesale Price Trend Analysis and Forecast
- Regulatory Framework
- List of Key Players
- Logistics and Infrastructure
- Seasonality Analysis
- Greece
- Production Analysis (Area Harvested, Yield, and Production Volume)
- Consumption Analysis (Consumption Value and Volume)
- Import Market Analysis (Import Value, Volume, and Key Supplying Markets)
- Export Market Analysis (Export Value, Volume, and Key Destination Markets)
- Wholesale Price Trend Analysis and Forecast
- Regulatory Framework
- List of Key Players
- Logistics and Infrastructure
- Seasonality Analysis
- Portugal
- Production Analysis (Area Harvested, Yield, and Production Volume)
- Consumption Analysis (Consumption Value and Volume)
- Import Market Analysis (Import Value, Volume, and Key Supplying Markets)
- Export Market Analysis (Export Value, Volume, and Key Destination Markets)
- Wholesale Price Trend Analysis and Forecast
- Regulatory Framework
- List of Key Players
- Logistics and Infrastructure
- Seasonality Analysis
- France
- Production Analysis (Area Harvested, Yield, and Production Volume)
- Consumption Analysis (Consumption Value and Volume)
- Import Market Analysis (Import Value, Volume, and Key Supplying Markets)
- Export Market Analysis (Export Value, Volume, and Key Destination Markets)
- Wholesale Price Trend Analysis and Forecast
- Regulatory Framework
- List of Key Players
- Logistics and Infrastructure
- Seasonality Analysis
- Spain
Data Validation & Update Cycle
Outputs were validated through triangulation across independent signals, including production and trade totals, price movements, and the implied per-capita consumption direction in large consuming countries. If an estimate moved outside what these signals could support, the assumptions were reviewed, and respondents were re-contacted to understand whether the issue came from timing, grade mix, or reporting differences.
A second analyst review was completed before sign-off, with specific variance checks on year-over-year changes, currency conversion timing, and price-to-volume consistency. Reports are refreshed annually, and interim updates are done when material events occur, such as large harvest shocks, major trade disruptions, or policy changes. Before delivery, we did a final pass to ensure the latest public releases were reflected in the numbers and narrative.
Mordor Intelligence's Europe Olive Market Size Compared Against Other Published Estimates
Published market sizes for Europe olives often do not match, even when the same years are mentioned, because the underlying counting rules can vary in quiet ways. Differences usually come from whether the value is captured at wholesale or at retail, how trade re-exports are handled, and which product forms are treated as part of the olive market.
Another driver is how price is modeled through volatile crop years, since using a single average price or a short time window can shift value sharply. Some estimates also apply wider country coverage or include adjacent processed products, and then convert currencies using different timing, which can change the reported USD value even when volumes look similar.
Benchmark comparison
| Source | Market Size | Gaps in Research Methodology |
|---|---|---|
| Mordor Intelligence | USD 17.40 B (2025) | |
| Industry Data Publisher A | USD 24.20 B (2024) | Uses a wholesale revenue view tied to producers and importers for a different base year, and the value boundary can shift depending on how trade hubs and re-exports within Europe are treated. |
| Regional Consultancy B | USD 8.19 B (2025) | Often reflects a narrower product and value scope, where parts of bulk trade, grade mix, or certain country flows can be counted differently, which tends to lower the realized price and total value. |
The spread in the table mainly comes from value-chain level and product-form coverage, followed by base-year choice and price averaging through unstable harvest seasons. When wholesale trade balances, consumption direction, and seasonal price curves are kept consistent in one model, the estimate stays more repeatable across years, which is why the wholesale-only treatment with explicit trade-balance checks was applied here by Mordor Intelligence near the end of the sizing build.


Key Questions Answered in the Report
What is the current value of the Europe olive commodity market?
The market is worth USD 18.2 billion in 2026 and is projected to reach USD 23.4 billion by 2031.
Which country consumes the most olives in Europe?
Italy leads with 24.8% of continental consumption in 2025.
Why are super-high-density orchards important for producers?
They cut labor needs, reach bearing age in three years, and lower break-even oil prices to about EUR 4.10 (USD 4.40) per kilogram.
Which country shows the fastest consumption growth?
Poland's olive intake is rising at a 7.4% CAGR through 2031.
What climate risk most affects European olive groves?
Extreme heatwaves and droughts threaten yields and may shrink suitable growing zones in southern Spain by 15% by 2030.
Page last updated on:






