
Market Overview
| Study Period | 2020 - 2031 |
|---|---|
| Forecast Data Period | 2026 - 2031 |
| Historical Data Period | 2020 - 2024 |
| Market Size (2026) | USD 64.18 Billion |
| Market Size (2031) | USD 92.44 Billion |
| Growth Rate (2026 - 2031) | 6.90% CAGR |
| Market Concentration | Medium |
Major Players *Disclaimer: Major Players sorted in no particular order Image © Mordor Intelligence. Reuse requires attribution under CC BY 4.0. | |
Mexico Commercial Real Estate Market Analysis by Mordor Intelligence
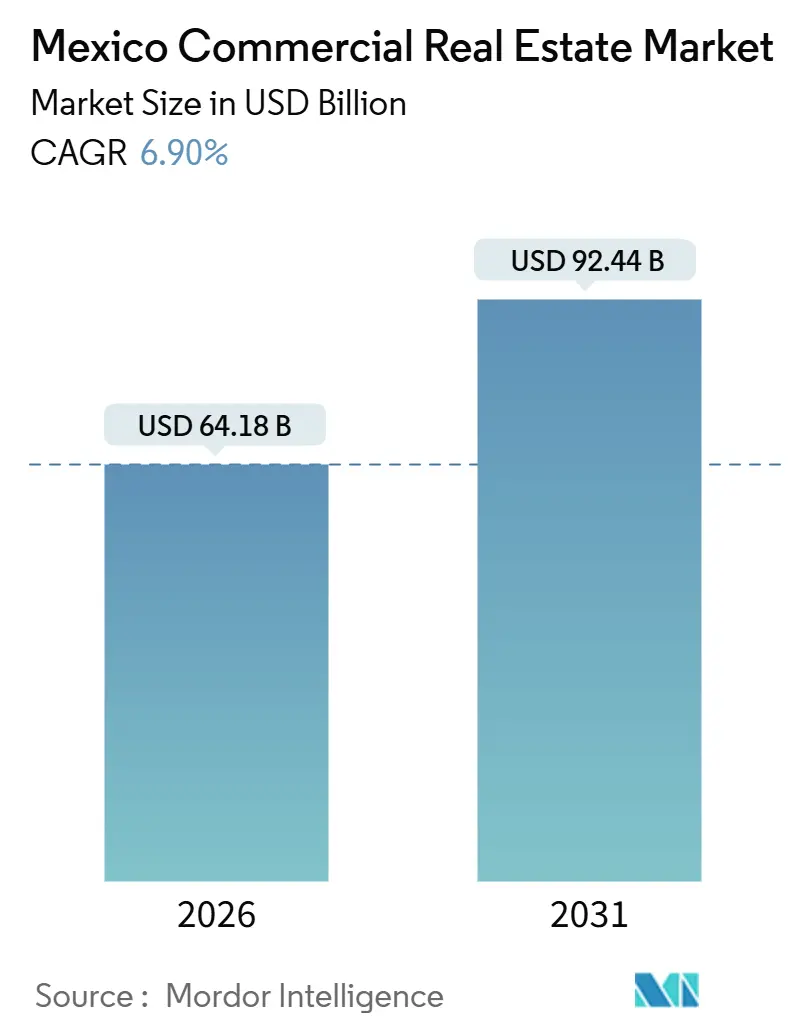
The Mexico commercial real estate market size is USD 64.18 billion in 2026 and is projected to reach USD 92.44 billion by 2031, registering a 6.9% CAGR. The Mexico commercial real estate market is pivoting from greenfield development to asset recycling as global firms favor portfolio acquisitions and turnkey capacity over new builds, despite headline FDI highs. New greenfield capital commitments fell to USD 3.17 billion in 2024, even as total FDI reached USD 36.87 billion, a mismatch that pushes demand toward pre-certified facilities and away from raw land. Logistics leads on both scale and growth as e-commerce penetration surpasses 84% and last‑mile fulfillment reshapes specifications in dense metro corridors. Occupancies near 98% in organized industrial parks and elongated permitting windows in top corridors increase the pricing power of developers who banked inventory during 2022 to 2024 and raise barriers for late entrants. Demand patterns also show a tilt to rentals as financing tightens and affordability strains persist, with households emerging as the fastest-growing end‑user while corporates and SMEs continue to dominate absorption.[1]https://www.imf.org/en/home
Key Report Takeaways
- By property type, logistics led with a 33.22% revenue share in 2025, and logistics is forecast to expand at an 8.1% CAGR to 2031.
- By business model, the sales segment held 68.44% of the Mexico commercial real estate market share in 2025, while rental posted the highest projected CAGR at 7.55% through 2031.
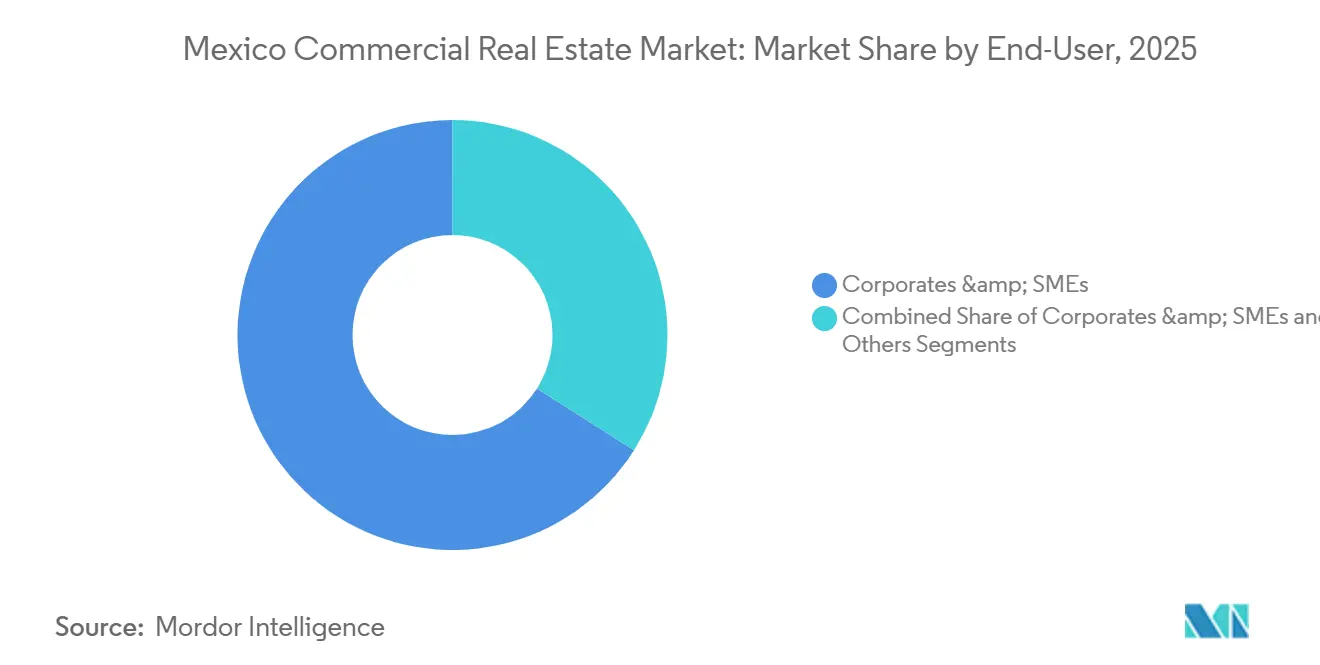
- By end‑user, corporates and SMEs accounted for a 71.45% share of the Mexico commercial real estate market size in 2025, and individuals and households are advancing at a 7.77% CAGR through 2031.
- By geography, Mexico City captured 24.33% in 2025, while Querétaro is forecast to expand at a 7.33% CAGR through 2031.
Note: Market size and forecast figures in this report are generated using Mordor Intelligence’s proprietary estimation framework, updated with the latest available data and insights as of January 2026.
Mexico Commercial Real Estate Market Trends and Insights
Drivers Impact Analysis*
| Drivers | (~) % Impact on CAGR Forecast | Geographic Relevance | Impact Timeline |
|---|---|---|---|
| Nearshoring‑Induced Industrial Demand Along The US–Mexico Border | +2.1% | Nuevo León, Baja California, Chihuahua, Coahuila, Tamaulipas | Medium term (2-4 years) |
| Expansion Of Data‑Centre Investments Fuelled by Fiber Upgrades | +1.8% | Querétaro, Monterrey, Guadalajara | Medium term (2-4 years) |
| E‑Commerce Growth Boosting Last‑Mile Logistics Space | +1.3% | Mexico City, Guadalajara, Monterrey, national metro corridors | Short term (≤ 2 years) |
| Peso Stability Attracting Foreign Institutional Investors to Offices | +0.9% | Mexico City CBD, Monterrey | Long term (≥ 4 years) |
| Rapid Urbanization of The Bajío Region Driving Mixed-Use Developments | +0.8% | Querétaro, Aguascalientes, Guanajuato, San Luis Potosí | Medium term (2-4 years) |
| PPP Transportation Corridors Lifting Retail Footfall in Secondary Cities | +0.5% | Bajío region, Mérida, Cancún | Long term (≥ 4 years) |
| Source: Mordor Intelligence | |||
Nearshoring Induced Industrial Demand along the US–Mexico Border
Mexico sustains top‑tier trade integration with the United States through 2025, and manufacturers seeking North American proximity prioritize turnkey capacity that accelerates time to operation. Greenfield flows lag, with new capital commitments at USD 3.17 billion in 2024 versus a record USD 36.87 billion total FDI, which channels leasing and acquisition demand into existing parks. Surveys indicate electricity and water shortfalls across organized industrial sites, so the Mexico commercial real estate market rewards developers who secured power and permits in advance. In Nuevo León, large announced projects face grid and permitting hurdles, reinforcing pre‑certified parks as the default landing zone for incoming tenants. The pending 2026 USMCA review tempers construction starts as firms seek clarity on rules of origin and tariff risks before locking capital, yet inquiry pipelines along border states remain strong for build‑to‑suit and ready‑to‑occupy products.[2]https://practiceguides.chambers.com/practice-guides/real-estate-2025/mexico/trends-and-developments
Expansion of Data‑Centre Investments Fuelled by Fiber Upgrades
Querétaro concentrates an estimated 65% of Mexico’s installed data‑center capacity, with multi‑billion‑dollar commitments from hyperscalers shaping power and connectivity buildouts. New routes like a diverse DWDM path between Querétaro and Monterrey improve redundancy, while private substations and regulatory fast‑tracking aim to ease grid constraints. AI workloads magnify energy intensity, so developers hedge with power‑adjacent sites and scalable interconnection in Monterrey as an overflow. The Mexico commercial real estate market now prices a digital‑adjacency premium for industrial land near these clusters. Pre‑leasing patterns and campus expansions show that data infrastructure is a durable, cross‑cycle driver of industrial and logistics valuations.[3]https://www.mdcdatacenters.com/
E‑Commerce Growth Boosting Last‑Mile Logistics Space
Online retail adoption crossed 84% in 2024, and parcel volumes during national promotions stress last‑mile capacity, pushing tenants to seek automation‑ready urban‑edge warehouses. The Mexico commercial real estate market sees higher premiums for facilities with high clear heights, heavy floor loads, and pre‑installed automation rails that shorten commissioning times. Operators scaling nationwide coverage demonstrate that self‑operated hubs paired with franchise logistics can lift service quality and reduce delivery times. These performance targets shift leasing from pure square‑meter metrics to technology readiness and energy resilience, such as solar‑ready roofs and smart inventory systems. Landlords that deliver plug‑and‑play layouts with embedded intelligence capture lease spreads over conventional stock.
Peso Stability Attracting Foreign Institutional Investors to Offices
Currency stabilization through mid‑2025 improves visibility for dollar‑denominated capital, supporting renewed interest in Mexico City’s Class A assets. Office absorption reached 175,000 square meters during the first three quarters of 2025, with technology, transport, and media tenants driving activity and a three‑days‑in workweek gaining traction. Premium towers with ESG credentials, wellness amenities, and flexible floorplates capture the bulk of demand while secondary submarkets trail. Pre‑leasing in key corridors tightens future availability and yields in the 7% to 8% range remain attractive against regional benchmarks. This bifurcation repositions trophy assets as core allocations for cross‑border investors within the Mexico commercial real estate market.
Restraints Impact Analysis*
| Restraints | (~) % Impact on CAGR Forecast | Geographic Relevance | Impact Timeline |
|---|---|---|---|
| Banxico’s Tight Monetary Stance Raising Borrowing Costs | -1.4% | National, acute in Mexico City and Monterrey | Short term (≤ 2 years) |
| Prolonged Zoning Approval Timelines in Mexico City Metro Area | -0.8% | Mexico City, Estado de México and adjacent municipalities | Medium term (2-4 years) |
| Construction‑Input Inflation Compressing Development Margins | -0.7% | National, steepest in Mexico City | Short term (≤ 2 years) |
| Security Concerns in Northern States Deterring International Tenants | -0.6% | Chihuahua, Sinaloa, Tamaulipas logistics routes | Long term (≥ 4 years) |
| Source: Mordor Intelligence | |||
Banxico’s Tight Monetary Stance Raising Borrowing Costs
Policy rates have moved lower since 2024, yet lending conditions remain tight, and spreads stay elevated, which constrains new development starts. Construction credit contracted in 2024 even as headline monetary easing progressed, reflecting bank risk repricing after large federal project cycles rolled off. Mortgage rates around 10.3% through mid‑2025 signal a wide gap from policy rates and caution lenders maintain in underwriting. For developers, all‑in debt costs near high single digits compress project returns and shift the Mexico commercial real estate market toward stabilized, income‑producing assets. ESG‑linked facilities offer modest funding advantages, favoring platforms with certified portfolios and scale.
Prolonged Zoning Approval Timelines in Mexico City Metro Area
Permitting in the capital region often takes 12 to 18 months, which doubles the wait relative to faster jurisdictions and adds soft costs that erode returns. New environmental and circularity compliance requirements scheduled for enforcement in 2025 introduce added documentation and certification fees. Smaller developers bear disproportionate burdens, which pushes some activity to neighboring municipalities where approvals move faster but tenant demand is thinner. The result is a spatial mismatch as occupiers prefer core submarkets while buildable sites cluster on the periphery. This friction keeps the Mexico commercial real estate market tight in core corridors and supports rent premiums for ready‑to‑occupy assets.
*Our forecasts treat driver/restraint impacts as directional, not additive. The impact forecasts reflect baseline growth, mix effects, and variable interactions.
Segment Analysis
By Property Type: Logistics Anchors Portfolio Velocity, Data Centers Redefine Industrial
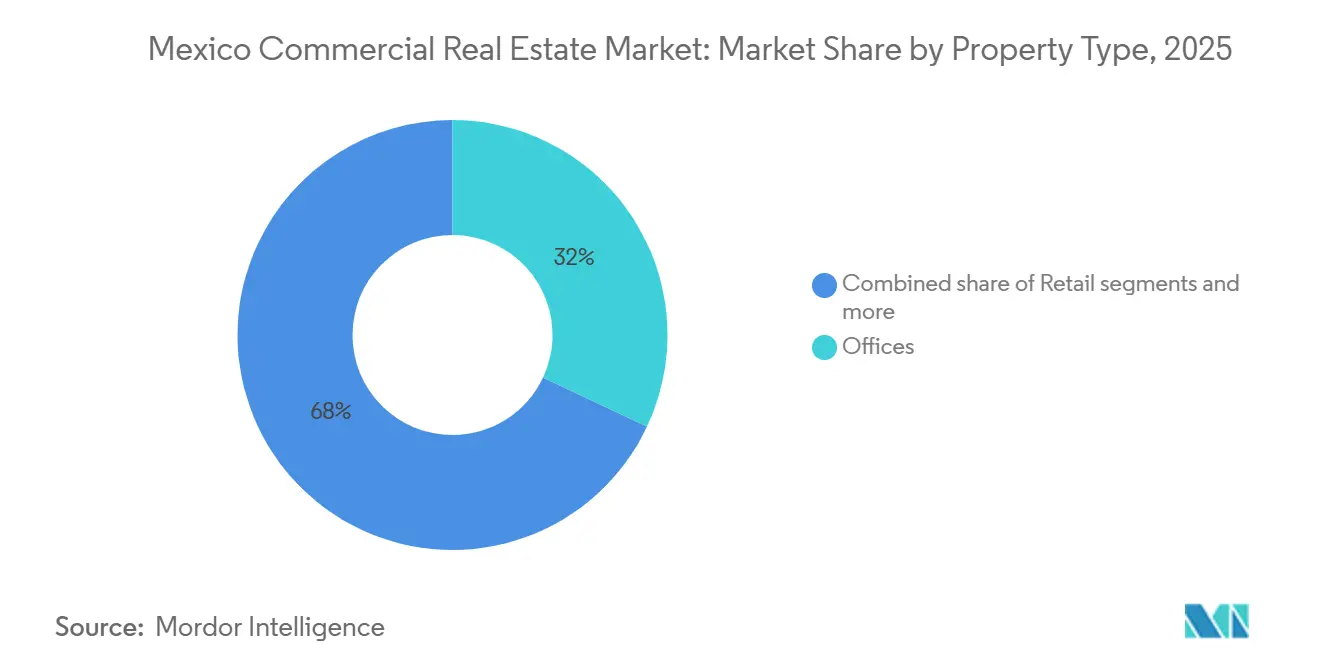
Logistics held 33.22% of the Mexico commercial real estate market share in 2025 and is forecast to expand at an 8.1% CAGR through 2031, the strongest pace among property types. The Mexico commercial real estate market benefits from e‑commerce penetration above 84%, which moves tenant demand toward urban‑edge micro‑fulfillment and high‑throughput hubs. Specifications such as 12‑meter clear heights, heavy floor loads, and pre‑installed automation rails shorten commissioning and support light assembly, labeling, and quality control. Querétaro’s concentration of data centers adds a power‑intensive category of “digital warehouses,” altering rent and cap‑rate benchmarks for nearby industrial corridors. Occupancies near 98% in organized industrial parks and 12 to 18‑month permitting windows tilt pricing power to owners who banked inventory from 2022 to 2024, while late entrants face high land costs and delayed approvals. The Mexico commercial real estate market size for logistics is projected to expand at an 8.1% CAGR between 2026 and 2031, driven by last‑mile density needs and pre‑leased hyperscale campuses that anchor broader industrial ecosystems.
Data‑center activity reinforces the logistics‑industrial continuum as power and fiber drive site selection and pre‑leasing decisions. A second fully diverse DWDM route linking Querétaro and Monterrey improves redundancy and positions Monterrey as an overflow node if power constraints bind in Querétaro. Developers that secure private substations and long‑term power agreements gain a leasing edge with cloud and AI tenants, while traditional warehouses command premiums when they are solar‑ready and automation‑ready. Office and retail trails logistics on growth but show signs of stabilization in core corridors, with amenity‑rich, ESG‑certified towers in Mexico City enjoying high occupancy and stronger rent resilience. The Mexico commercial real estate industry, in turn, adopts mixed‑use integration where campus amenities, wellness, and flexible workspaces support diversified cash flows for landlords.


By Business Model: Rental Gains Share as Affordability Crisis Redirects Capital
Sales accounted for 68.44% of market value in 2025, but its growth outlook at 6.9% CAGR trails rental, which is set to grow at 7.55% annually through 2031. Elevated spreads between policy rates and mortgage rates, tighter underwriting, and high transaction costs encourage occupiers to lease longer and defer purchases. Office landlords in Mexico City shift to longer tenures with inflation‑linked escalators and higher tenant improvement packages to lower entry costs and attract fast‑growing tech and services tenants. Industrial developers add power‑purchase agreements and rooftop solar to leases, bundling energy with space to secure longer commitments and stabilize cash flows. The Mexico commercial real estate market reflects this rotation as institutional investors favor platforms with recurring rental income and scaled property management capabilities.
Three reinforcing effects sustain rental’s lead on growth near term. First, developers who can no longer pencil attractive unlevered returns under higher input costs prefer to build‑to‑lease for credit tenants rather than build‑to‑sell. Second, fractional and exchange‑traded vehicles continue to attract retail capital into listed structures instead of direct acquisitions, enhancing liquidity and lowering minimums for investors. Third, city‑level rental reforms standardize lease terms and encourage formalization, which reduces default risk and draws more institutional landlords. The Mexico commercial real estate industry responds with portfolio strategies that prioritize stabilized occupancy, ESG credentials, and tenant retention in core submarkets.
By End‑User: Corporates Dominate Absorption, Households Post Steepest Growth
Corporates and SMEs captured 71.45% of end‑user demand in 2025 as industrial parks operated near full occupancy, and Mexico City’s core submarkets led office absorption. Tenants with export mandates prioritize certified parks that align with customs and tax programs, which favors professional developers with regulatory expertise and scale. Technology firms drive a large share of office take‑up and require fiber‑rich buildings, flexible floorplates, and building‑level ESG adherence. The Mexico commercial real estate market sees concentrated activity in trophy corridors where these specifications are standard, while secondary submarkets lag. Occupier decisions emphasize energy reliability and compliance, which sustains the premium for certified campuses and lowers churn.
Individuals and households post the fastest CAGR at 7.77% through 2031 as affordability constraints redirect demand into formal rental. Social‑leasing initiatives and urban migration to industrial corridors add momentum in major metros and fast‑growing Bajío cities. Renters favor smaller units near employment centers, and new stock attempts to balance yield with accessibility in submarkets with improved transit or proximity to large parks. The Mexico commercial real estate industry adapts by layering co‑living, serviced apartments, and mixed‑use formats to serve this demand without diluting asset quality. Policy and incentive zones along the borders keep corporate demand anchored, which indirectly supports rental housing in surrounding municipalities.

Geography Analysis
Mexico City accounts for 24.33% of the market value in 2025 and concentrates the largest tech workforce in Latin America, which supports office absorption and mixed‑use strength. Class A towers with ESG credentials and wellness amenities maintain near‑full occupancy even as citywide vacancy remains higher due to obsolescence in secondary stock. New supply under construction shows meaningful pre‑leasing, and return‑to‑office norms at three or more days per week stabilize tenant footprints. High permitting friction keeps the Mexico commercial real estate market tight in core corridors, which sustains pricing power for ready‑to‑occupy assets. Developers enhance building value with amenities and flexible workspaces that support community and retention in the Central Business District.
Border‑adjacent Nuevo León leads in industrial construction and is a prime gateway for nearshoring tenants, though energy and water constraints limit the pace of delivery. Very high park occupancy and rail enhancements strengthen the state’s connectivity and positioning for logistics and manufacturing. Guadalajara benefits as a secondary tech hub with lower office vacancy than the capital and a more balanced supply pipeline. The Mexico commercial real estate market distributes demand across these metros as tenants calibrate rent, power availability, and labor pools. Estado de México absorbs overflow from the capital but trades lower land costs against longer approvals and weaker transit links.
Querétaro records the fastest growth with a 7.33% CAGR on the back of hyperscale data‑center campuses and a dense fiber backbone. The state’s installed base shapes industrial land valuations as sites near existing campuses command digital‑adjacency premiums. Power constraints are the key systemic risk and could redistribute future investments to Monterrey or Guadalajara if grid expansion lags workload growth. The Mexico commercial real estate market size attribution reflects this concentration as Querétaro captures a growing slice of new industrial commitments while Mexico City remains the largest node by value. Secondary Bajío cities advance as improved corridors expand catchment areas for retail and mixed‑use developments.
Regulatory Landscape
Mexico's commercial real estate activity is shaped by federal land and urban-development rules, with zoning, licensing, and permitting handled at state and municipal levels. Federally, SEDATU anchors land-use and territorial planning under the Ley General de Asentamientos Humanos, Ordenamiento Territorial y Desarrollo Urbano, while the Ley General de Bienes Nacionales governs how national property is administered and transacted when projects involve federal assets or rights-of-way.
On the technical and compliance side, mandatory Official Mexican Standards (NOMs) and the national quality infrastructure led by Secretaria de Economia affect project documentation and conformity assessment workflows, with PLATIICA and the Sistema Nacional de Infraestructura de la Calidad acting as reference points for standards information and compliance processes. NOM-005-SEDATU-2024 (published July 2024) sets general contents for municipal territorial and urban development plans and has been in effect since January 2025. In addition, SEDATU's updated internal regulations effective April 1, 2026 clarified competencies across subsecretariats involved in territorial planning, land, and housing, aligning federal administration with permitting and plan-review practices.
Value Chain Analysis
Mexico's commercial real estate value chain spans land assembly and feasibility (title review, zoning alignment, and utility due diligence), design and construction, leasing and brokerage, and ongoing asset and property management. Institutional capital and FIBRA platforms increasingly recycle assets through acquisitions and portfolio optimization, while developers and contractors manage the critical path around permits and utility interconnection. Brokers, facility managers, and valuation and advisory firms support absorption, tenant retention, and transaction execution across office, retail, and logistics/industrial assets.
On the input side, building materials and subcontracting are major cost drivers in construction. Under the LOPSRM framework, cost escalation mechanisms in public works reference Mexico's price indexes (INEGI), influencing contractor pricing discipline and risk allocation. Two bottlenecks affect delivery timelines and specifications for industrial and logistics assets, power availability and grid readiness, and logistics connectivity to ports, rail, and last-mile corridors. Infrastructure programs provide upstream support to real estate throughput, including the Interoceanic Corridor of the Isthmus of Tehuantepec (CIIT) as a multimodal platform integrating ports and rail, and large intermodal nodes such as the Salinas Victoria Intermodal Complex in Nuevo Leon, which strengthen integrated logistics campuses that combine warehousing with rail and customs processing.
Competitive Landscape
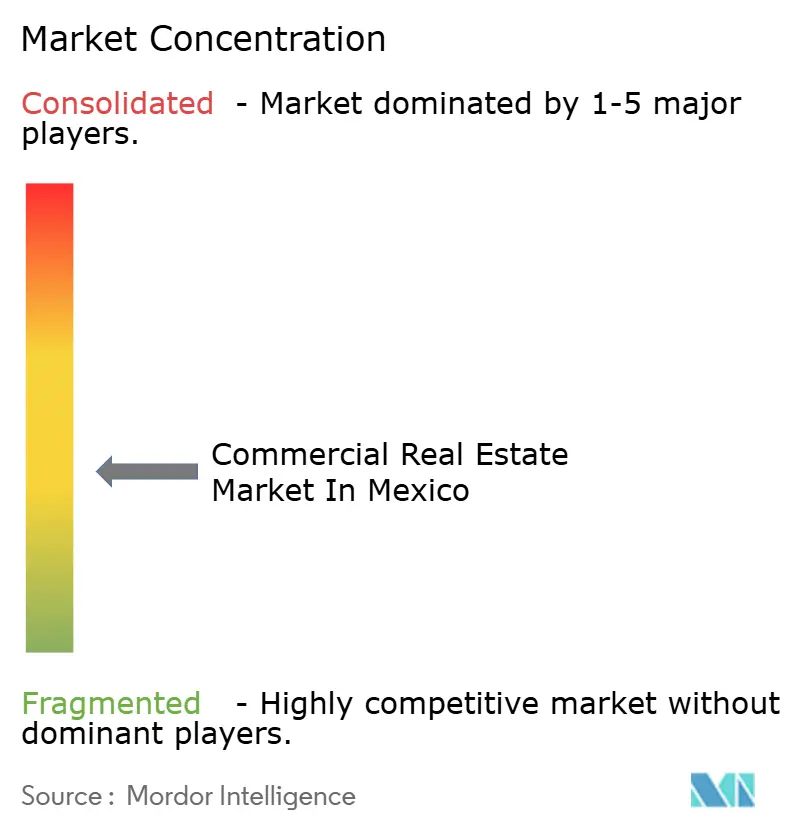
The Mexico commercial real estate market is fragmented. Industrial and logistics exhibit moderate concentration among institutional landlords, with scale vehicles expanding through consolidation and selective development. A landmark transaction integrated Terrafina into FIBRA Prologis, creating a national leader with large‑tenant reach and improved capital markets access. Vesta’s sustainability‑linked financing and certification targets highlight an ESG‑led differentiation strategy that aligns with global capital mandates. FIBRA Uno pivots toward development yield capture through a specialized platform while navigating a stricter credit backdrop. The Mexico commercial real estate market rewards platforms that control shovel‑ready land, utility connections, and leasing pipelines with high-credit tenants.
Office and retail remain fragmented, which limits scale efficiencies but enables niche positioning and amenity‑driven strategies. Mexico City’s trophy towers lead on occupancy and pricing, while secondary stock in outer submarkets lags. Mixed‑use flagships that integrate retail, office, and residential demonstrate stronger resilience and leasing velocity. The Mexico commercial real estate market sees owners deepen property management capabilities and focus on wellness, ESG, and flexible layouts to defend cash flows. Retail strategies emphasize sales per square meter and hybrid tenant mixes, with health and experience anchors stabilizing traffic.
Developers compress delivery timelines by internalizing design, construction, and leasing and by pre‑leasing a portion of GLA before breaking ground. New fiber routes and private substations around data‑center clusters shape land acquisition and forward leasing in key states. Capital recycling remains active as listed vehicles dispose of non‑core assets and fund projects in high‑demand corridors. The Mexico commercial real estate market is increasingly differentiating on certifications and compliance as export‑oriented occupiers demand audited standards. Platforms that align regulatory readiness, ESG, and infrastructure access hold an advantage in tenant selection and pricing.
Mexico Commercial Real Estate Industry Leaders
Fibra Uno (FUNO)
FIBRA Prologis (FIBRAPL)
FIBRA Macquarie México (FIBRAMQ)
FIBRA Monterrey (FMTY)
FIBRA Danhos (DANHOS)
- *Disclaimer: Major Players sorted in no particular order

Market Opportunities and Future Outlook
A key opportunity in Mexico commercial real estate is the delivery of pre-certified, utility-secured industrial and logistics stock that shortens tenant time-to-operation, especially in corridors where organized parks operate at very high occupancy and power remains the primary gating factor. Industry and institutional signals support continued deployment, with AMPIP describing a 2026 industrial park investment program of USD 5.831 billion alongside an installed base of 477 operational industrial parks hosting over 4,000 companies and supporting 3.7 million jobs, which points to the scale at which incremental, standards-compliant capacity can be absorbed when sites are power-ready.
Digital infrastructure is another whitespace driver with direct linkages to industrial land valuation and leasing velocity, with Queretaro remaining the main data-center cluster and hyperscale requirements often cited in the 100 to 400 MW per campus range. That feeds a premium for power-adjacent sites and redundancy-ready connectivity. At the macro layer, Plan Mexico and the 2025-2030 National Development Plan offer an organizing umbrella for nearshoring and infrastructure priorities, while market participants increasingly structure projects around execution constraints such as electricity, water security, and logistics connectivity, rather than greenfield land optionality. This supports demand for integrated parks that bundle utility solutions and compliance-ready documentation, as well as urban-edge logistics formats that are automation-ready for last-mile throughput in dense metro corridors.
Recent Industry Developments
- July 2026: FIBRA Prologis called an ordinary certificate holders meeting for July 17, 2026 to vote on a sponsor incentive fee payment and the potential issuance of additional CBFIs. The agenda underscores how large industrial REIT platforms are using governance and capital-markets tools to maintain acquisition and portfolio-management flexibility during consolidation cycles.
- November 2025: FIBRA Prologis concluded its public acquisition offer for 100% of Terrafina's CBFIs, reaching 99.82% ownership and triggering a delisting from the Mexican Stock Exchange effective December 1, 2025. The transaction expanded scale in Class A industrial assets and reinforced consolidation as a way to capture nearshoring-driven leasing depth across Mexico.
- July 2024: NOM-005-SEDATU-2024 was published, establishing general contents for municipal territorial and urban development plans and has been in effect since January 2025. The update anchors planning standardization and aligns federal planning competencies with evolving permitting and plan-review practices.


Research Methodology Framework and Report Scope
Market Definition and Coverage
For this report, the Mexico commercial real estate market is defined as the value of income-generating, non-residential property assets across Mexico, tracked through completed and stabilized space and the related investment activity reflected in market pricing.
Scope exclusions: Residential property, construction contracting revenues, pure brokerage or leasing-only fees, and bare land trades without development permits are excluded.
Segmentation Overview
- By Property Type
- Offices
- Retail
- Logistics
- Others (Industrial, Hospitality, etc.)
- By End-User
- Individuals / Households
- Corporates & SMEs
- Others
- By States
- Mexico City (CDMX)
- Nuevo Leon
- Jalisco
- Queretaro
- Mexico State (Edomex)
- Rest of Mexico
Data Validation & Update Cycle
Outputs were validated through triangulation across three layers: operating metrics (space, occupancy, absorption), investment metrics (pricing and cap rates), and macro signals (output, trade, and employment). If the model produced sharp year-on-year moves, we rechecked the drivers, revisited outlier assumptions, and re-read sources to confirm timing and currency conversion.
Before sign-off, results go through analyst review steps that compare totals with independent indicators and with what practitioners are seeing on the ground. Reports are refreshed annually, and interim updates are made when material events shift leasing, financing, or pricing conditions. Right before delivery, we run a final pass so clients receive the most current view that can be defended with clear inputs.
Mordor Intelligence's Mexico Commercial Real Estate Market Size Measured Against Other Published Estimates
Different published numbers for Mexico commercial real estate can look far apart because the underlying measurement unit is not always the same, and because scope lines are not drawn in the same place. Some sources focus on deals closed in a year, others anchor the size to outstanding property value, and the timing of currency conversion can also change the USD total.
Construction services and contractor revenues sit outside Mordor Intelligence's scope, which is one reason our 2026 market value does not move in tandem with estimates built around annual transaction flow or development spending. Differences also come from how quickly rents and cap rates are assumed to reset, whether only institutional-grade assets are counted, and how often assumptions are refreshed when vacancy or absorption shifts.
Benchmark comparison
| Source | Market Size | Gaps in Research Methodology |
|---|---|---|
| Mordor Intelligence | USD 64.18 B (2026) | |
| Global Consultancy A | USD 53.60 B (2024) | Uses transaction value as the market size lens, which can understate total outstanding asset value in years with fewer large deals, and it also reflects a different base year. |
| Industry Portal B | USD 75.99 B (2029) | Forward number is tied to a deal-flow style forecast horizon, and it can assume faster repricing or broader inclusion of development-linked activity, which lifts the total versus a stabilized-asset value build. |
The spread across these figures mainly comes down to whether the metric is asset value versus transaction flow, along with timing and pricing assumptions. By keeping the model tied to space-level operating signals and then validating pricing and yield assumptions through interviews, we keep the market size traceable to inputs that can be checked and repeated year after year.


Key Questions Answered in the Report
What is the Mexico commercial real estate market growth outlook through 2031?
The market is projected to grow from USD 64.18 Billion in 2026 to USD 92.44 billion by 2031 at a 6.9% CAGR, led by logistics and data centre adjacency dynamics.
Which property type leads the Mexico commercial real estate market and why?
Logistics leads with a 33.22% share in 2025 and the fastest 8.1% CAGR through 2031 due to e-commerce density, last-mile demand, and automation-ready specifications in urban edge warehouses.
How are financing conditions shaping development decisions in Mexico's commercial real estate?
Despite policy rate cuts, lending spreads remain elevated, and construction credit is tight, which pushes developers toward stabilized rentals and build to lease structures rather than speculative sales.
Where are the fastest growing geographies within Mexico commercial real estate?
Querétaro records the steepest CAGR at 7.33% as hyperscale data centre campuses expand, while Mexico City remains the largest node by value with tight Class A office dynamics.
What makes rentals outperform sales in the Mexico commercial real estate market?
Rentals benefit from affordability pressures, tighter mortgage underwriting, and landlord offerings like inflation linked leases, energy bundles, and higher TI packages that reduce occupier capex.
How does data centre expansion affect the broader Mexico commercial real estate market?
Hyperscale campuses concentrate in power and fiber-rich corridors, creating digital adjacency premiums for nearby industrial land and tightening pre-leasing in Monterrey and Querétaro as grid upgrades progress.
Page last updated on:




