
Market Overview
| Study Period | 2021 - 2031 |
|---|---|
| Market Volume (2026) | 87.45 Million tons |
| Market Volume (2031) | 107.06 Million tons |
| Growth Rate (2026 - 2031) | 4.13% CAGR |
| Fastest Growing Market | Asia Pacific |
| Largest Market | Asia Pacific |
| Market Concentration | Medium |
Major Players *Disclaimer: Major Players sorted in no particular order Image © Mordor Intelligence. Reuse requires attribution under CC BY 4.0. | |
Chlorine Market Analysis by Mordor Intelligence
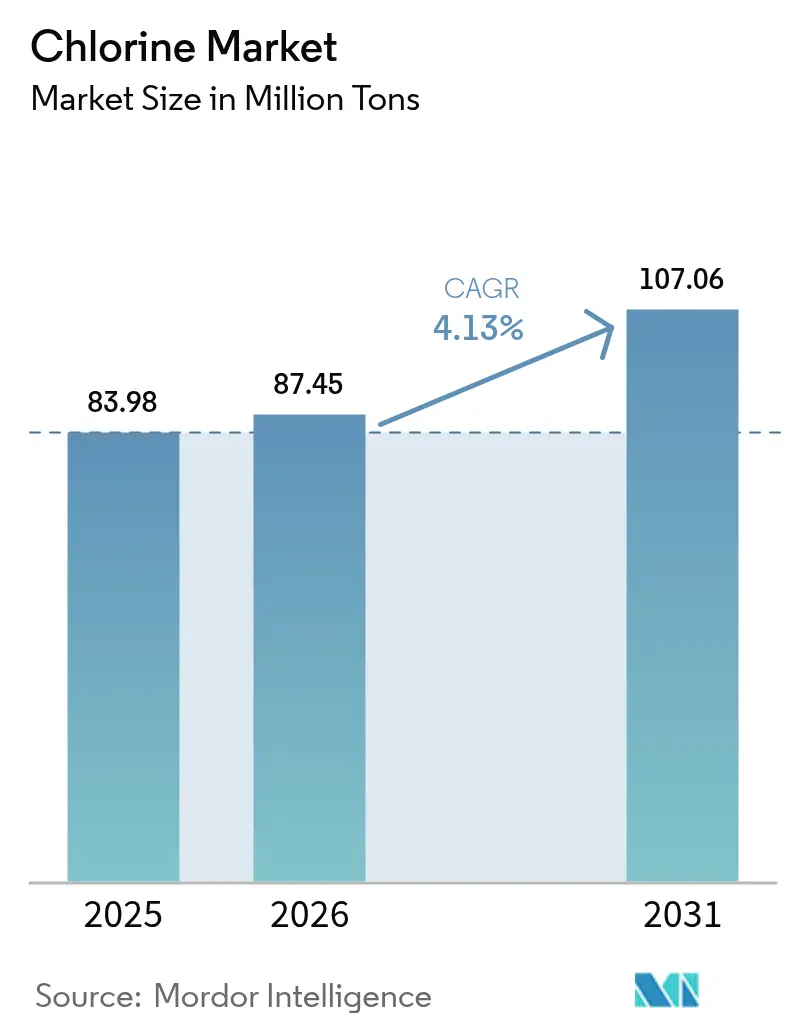
The Chlorine Market size was valued at 83.98 Million tons in 2025 and is estimated to grow from 87.45 Million tons in 2026 to reach 107.06 Million tons by 2031, at a CAGR of 4.13% during the forecast period (2026-2031). Elevated membrane-cell capacity in China, integration with polyvinyl chloride (PVC) chains in the Middle East, and large-scale municipal water programs in India jointly underpin volume expansion across the chlorine market. Merchant-grade price swings have become more pronounced because caustic-soda oversupply now drives plant-operating decisions more than chlorine demand, sending spot prices briefly negative in parts of Europe in 2024. Structural competitiveness continues to migrate toward Asia-Pacific and the Gulf Cooperation Council, where salt and electricity costs remain far below Western averages, while specialty-grade niches for semiconductors and batteries create premium pockets inside the broader chlorine market. In parallel, distributed on-site electro-chlorination is eroding bulk-rail volumes in North America and Europe as utilities look to mitigate hazardous-material transport risks highlighted by the February 2021 winter-storm outages.
Key Report Takeaways
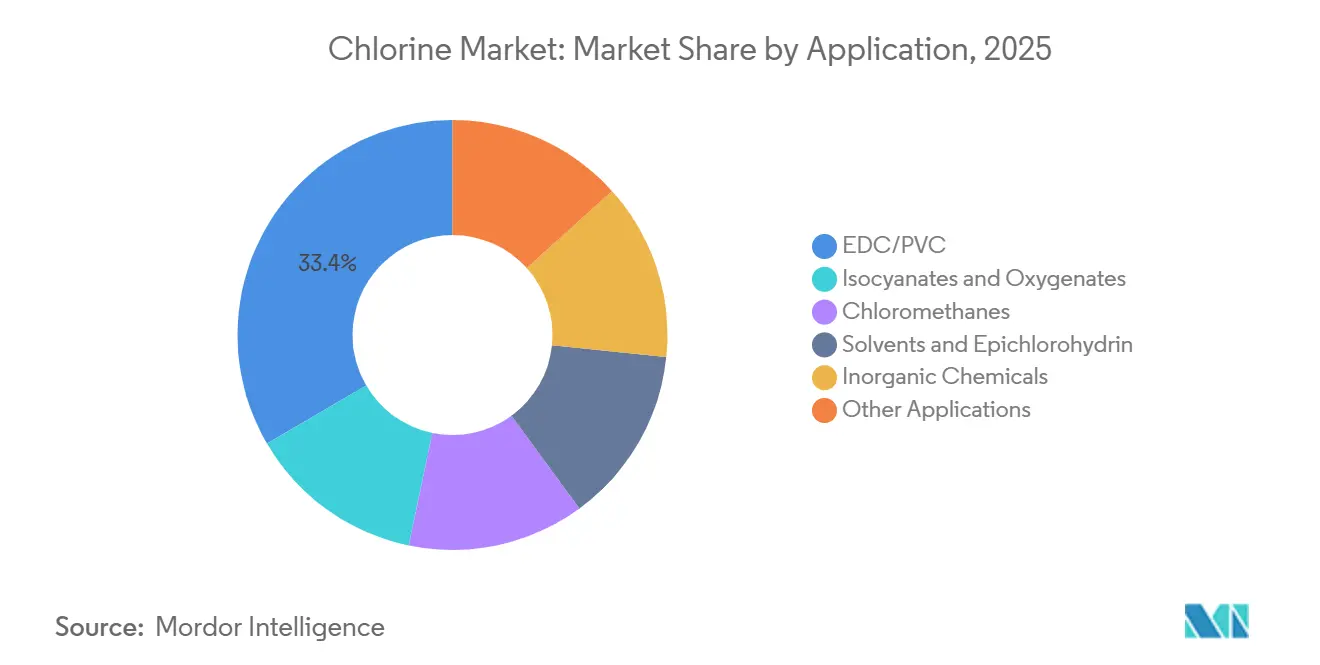
- By application, EDC/PVC accounted for 33.42% of the chlorine market share in 2025; isocyanates and oxygenates are projected to advance at a 4.46% CAGR through 2031.
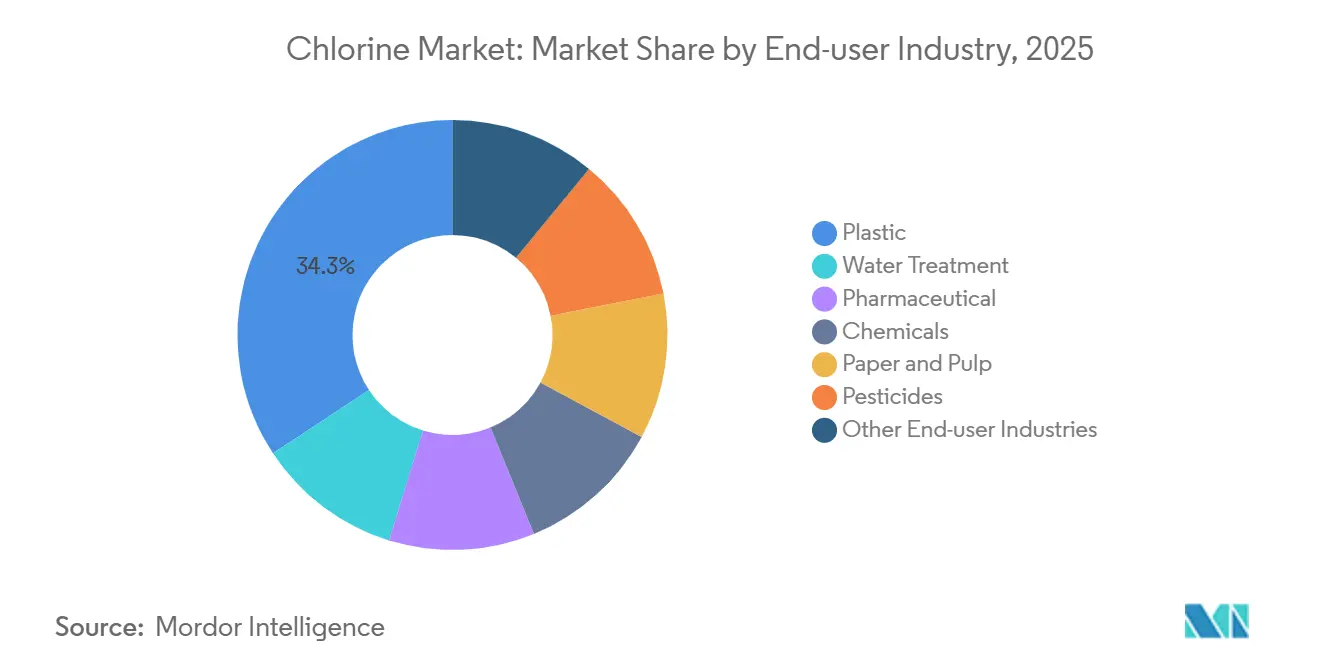
- By end-user, plastics held 34.26% of demand in 2025, while water treatment is set to grow at the fastest 4.66% CAGR over the same horizon.
- By geography, Asia-Pacific captured 64.17% of global volume in 2025, and it is poised to post the highest 4.76% CAGR until 2031.
Note: Market size and forecast figures in this report are generated using Mordor Intelligence’s proprietary estimation framework, updated with the latest available data and insights as of 2026.
Global Chlorine Market Trends and Insights
Drivers Impact Analysis*
| Driver | (~) % Impact on CAGR Forecast | Geographic Relevance | Impact Timeline |
|---|---|---|---|
| Surging PVC demand in construction and packaging | +1.2% | Asia-Pacific core, spill-over to Middle East | Medium term (2–4 years) |
| Rapid municipal and industrial wastewater investments | +1.0% | Global, with early gains in India and Southeast Asia | Long term (≥ 4 years) |
| Pharmaceutical generics boom (post-patent expiries) | +0.6% | Asia-Pacific, North America | Short term (≤ 2 years) |
| Battery-grade metal chlorides for solid-state EV cells | +0.5% | Asia-Pacific, North America, Europe | Long term (≥ 4 years) |
| Semiconductor etchant demand from sub-5 nm fabs | +0.4% | Asia-Pacific, North America | Medium term (2–4 years) |
| Source: Mordor Intelligence | |||
Surging PVC Demand in Construction and Packaging
PVC resin manufacture absorbed 33.42% of global chlorine in 2025 as China’s urbanization push and India’s infrastructure outlays of INR 10 trillion (USD 120 billion) kept pipe, profile, and film demand elevated[1]Press Information Bureau, “Jal Jeevan Mission Progress Update,” pib.gov.in. Operating-rate gaps remain wide, with Europe languishing at 65–72% and Qatar Vinyl Company adding 350,000 t pa of PVC in 2025. Recycled-content mandates in the European Union are paradoxically lifting virgin PVC offtake wherever mechanical recycling degrades polymer chains. Integrated vinyl chains inside the chlorine market soften price volatility because captive chlorine can be rebalanced internally, an edge pure-play merchants lack.
Rapid Municipal and Industrial Wastewater Investments
Municipal disinfection consumed 1,039 million kg of US chlorine in 2019, and the Jal Jeevan Mission has already extended tap water to 146.3 million Indian households by January 2025, a trajectory expected to raise regional chlorine market demand at above-average rates[2]U.S. Environmental Protection Agency, “Winter Storm Uri After-Action Report,” epa.gov. Europe’s Drinking Water Directive 2020/2184 forces utilities to tighten chlorate limits by 2026, favoring on-site hypochlorite generators that still require chlorine feedstock. Industrial wastewater treatment for pulp, textile, and petrochemical plants is adopting electro-chlorination, further embedding chlorine into compliance roadmaps.
Pharmaceutical Generics Boom (Post-Patent Expiries)
Patent expirations are steering a new wave of off-patent drugs, pushing India’s active-pharmaceutical-ingredient market toward USD 38.76 billion by 2030. Chlorination remains central to synthesizing intermediates such as chloro-quinoline derivatives, and continuous-flow reactors that meet ICH Q3D impurity norms are scaling up in both India and China. Efficiency improvements trim chlorine intensity per kilogram, but overall volume growth keeps the chlorine market expanding inside the life-science supply chain.
Battery-Grade Metal Chlorides for Solid-State EV Cells
Chloride solid electrolytes, delivering ionic conductivities of 13.7 mS/cm, underpin emerging solid-state designs that could reach pilot scale by 2028. If 5% of global electric-vehicle output adopts chloride chemistries by 2031, specialty-grade demand might rise by 50,000–100,000 t of chlorine equivalent. Producers with pharmaceutical-grade purification lines can thus diversify away from commodity vinyls and capture higher-margin niches within the chlorine market.
Restraints Impact Analysis*
| Restraint | (~) % Impact on CAGR Forecast | Geographic Relevance | Impact Timeline |
|---|---|---|---|
| Caustic-soda over-supply squeezing integrated margins | -0.80% | Global, acute in Europe and North America | Short term (≤ 2 years) |
| Bromine-based biocide substitution in cooling towers | -0.30% | North America & Europe, emerging in Asia-Pacific industrial sectors | Medium term (2-4 years) |
| On-site electro-chlorination units curbing bulk Cl₂ haulage | -0.50% | North America, Europe, emerging in Asia-Pacific | Medium term (2-4 years) |
| Source: Mordor Intelligence | |||
Caustic-Soda Over-Supply Squeezing Integrated Margins
Worldwide expansions pushed caustic-soda prices to multi-year lows in 2024, forcing some European sellers to actually pay buyers to take chlorine away, an unprecedented distortion in the chlorine market. Olin’s chlor-alkali revenue fell from USD 632.8 million in Q3 2023 to USD 572.8 million a year later, confirming margin compression. Plant closures in France and Germany illustrate how energy prices above EUR 150 MWh destroy integrated economics, whereas Middle Eastern units with USD 20–30 MWh power remain profitable.
On-Site Electro-Chlorination Units Curbing Bulk Cl₂ Haulage
Cities and industrial parks are shifting to brine-electrolysis units that eliminate railcar chlorine deliveries, cutting hazmat exposure and trimming chlorine market volumes available to merchants. Chlorum Solutions spent over USD 70 million on its Arizona hypochlorite hub, and similar salt-to-bleach projects are advancing in California. Payback periods of 3–5 years and lower compliance costs encourage adoption for any site consuming more than 100 t annually.
*Our forecasts treat driver/restraint impacts as directional, not additive. The impact forecasts reflect baseline growth, mix effects, and variable interactions.
Segment Analysis
By Application: PVC Chains Remain the Anchor of Demand
EDC and PVC absorbed 33.42% of the worldwide chlorine in 2025, confirming that vinyl integration stabilizes the chlorine market size against co-product swings. Parallel investments such as PT Chandra Asri’s 1.1 million-t pa EDC unit in Indonesia are aimed at meeting Southeast Asian PVC shortfalls. The chlorine market share for isocyanates and oxygenates is poised to expand fastest, lifted by insulation and auto lightweighting foam needs. Phosgene reactors converted to continuous flow raise safety while shaving chlorine consumption per ton of MDI, yet absolute growth still favors higher basal volumes.
Secondary uses span chloromethanes, solvents, epichlorohydrin, and inorganic reagents. Regulatory moves, including the Kigali Amendment, are phasing down some refrigerant pathways, but titanium dioxide and ferric chloride output in China and India keeps diversified, drawing on the chlorine market. Membrane-cell energy intensity now averages 2,000–2,200 kWh/t, and oxygen-depolarized cathode pilots promise another 20–30% gain, potentially freeing capacity without new brine feeds.



By End-User Industry: Water Treatment Gains the Momentum
Plastics dominated the chlorine market with 34.26% share in 2025, yet the water treatment industry is the fastest riser, projected at 4.66% CAGR to 2031 as India’s Jal Jeevan Mission scales toward universal coverage. Semiconductor fabs and pharmaceutical plants, both chlorine-intensive, are shifting the quality mix upward toward electronic and pharma grades, increasing average value per ton inside the chlorine market.
Paper-and-pulp bleaching relies mostly on chlorine dioxide but still depends on chlorine precursor chemicals, anchoring a stable, mature slice of demand. Pesticides see divergent trends: legacy organochlorines fade, but new actives such as chlorantraniliprole still involve chlorinated intermediates, cushioning total volumetric impact.
Geography Analysis
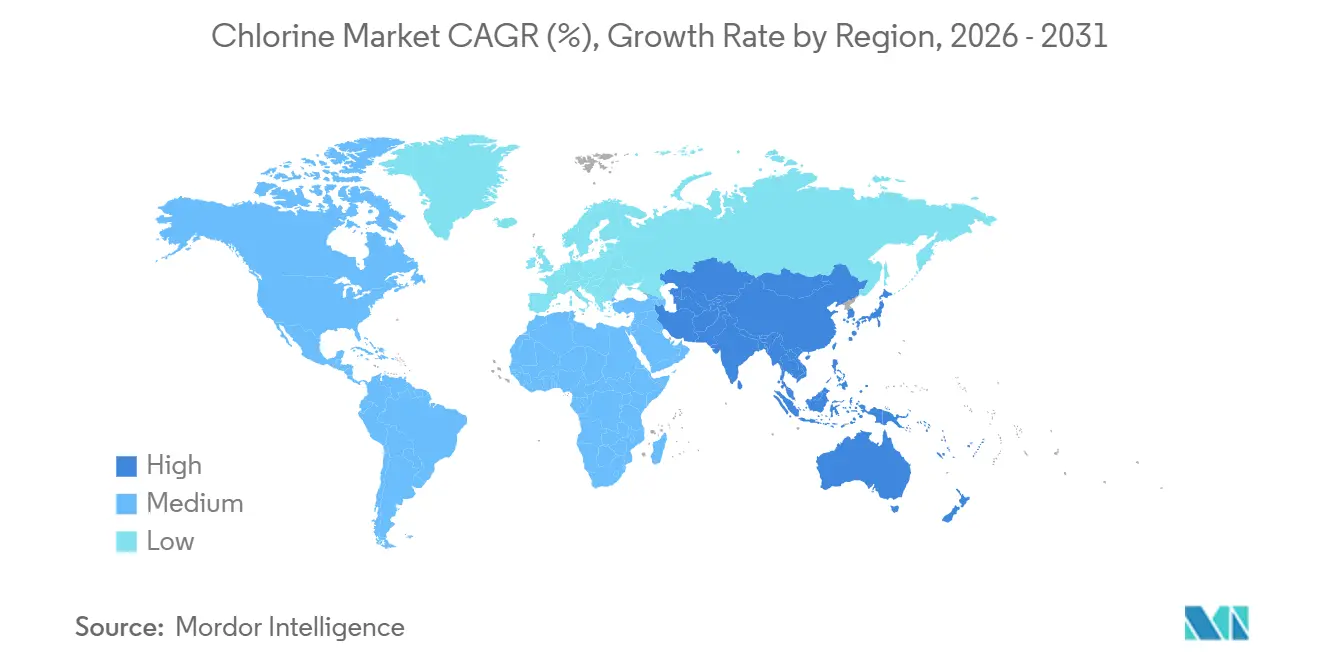
Asia-Pacific dominates the chlorine market, holding 64.17% of global volume in 2025 and set for a 4.76% CAGR through 2031, underpinned by China’s 42.16 million-ton caustic-soda output and near-complete membrane-cell penetration. India’s INR 70,163 crore (USD 8.4 billion) water program keeps municipal demand rising, while 42 leading-edge semiconductor fabs under construction in Taiwan and South Korea are shifting a slice of chlorine toward 5N-plus purity categories.
North America’s shale-linked power advantage keeps integrated Gulf Coast complexes competitive even as caustic prices sag. Olin and Mitsui’s Blue Water Alliance is a template for asset pooling that balances chlorine market volumes with regional caustic draw. Europe, facing triple-digit electricity costs, continues to rationalize, with Dow and Arkema trimming combined capacity by over 400,000 t between 2024 and 2027. Carbon Border Adjustment Mechanism tariffs, effective in 2026, could moderate import pressure, but long-term cost parity remains uncertain.
Brazil, Saudi Arabia, and South Africa anchor smaller but strategically relevant chlorine markets. Qatar Vinyl Company’s 350,000 t pa PVC unit leverages USD 20–30 MWh gas-based power, giving Gulf exporters a freight-parity edge into Africa and South Asia. South Africa’s load-shedding keeps domestic rates volatile, opening windows for imports from the Middle East.

Value Chain Analysis
The chlorine value chain begins with upstream inputs of salt (brine), water, and high-reliability electricity feeding chlor-alkali electrolysis, with membrane-cell technology dominating production. Chlorine output is tightly linked to co-generation of caustic soda and hydrogen, so operating rates and profitability depend on balancing these coproduct outlets as much as chlorine demand, as reflected in 2024 merchant-grade volatility when caustic-driven operating decisions pushed chlorine spot pricing briefly negative in parts of Europe.
Midstream conversion routes consume most chlorine captively in integrated chains such as EDC/VCM/PVC, while merchant chlorine flows into water treatment and a range of inorganic and organic intermediates. Downstream distribution is shaped by hazardous-material handling requirements, which supports a split between bulk transport (railcar, barge, cylinder) and localized models such as on-site electro-chlorination that convert brine to hypochlorite at or near the point of use, reducing bulk Cl2 logistics while still relying on the same electrolytic capability and associated service ecosystem.
Competitive Landscape
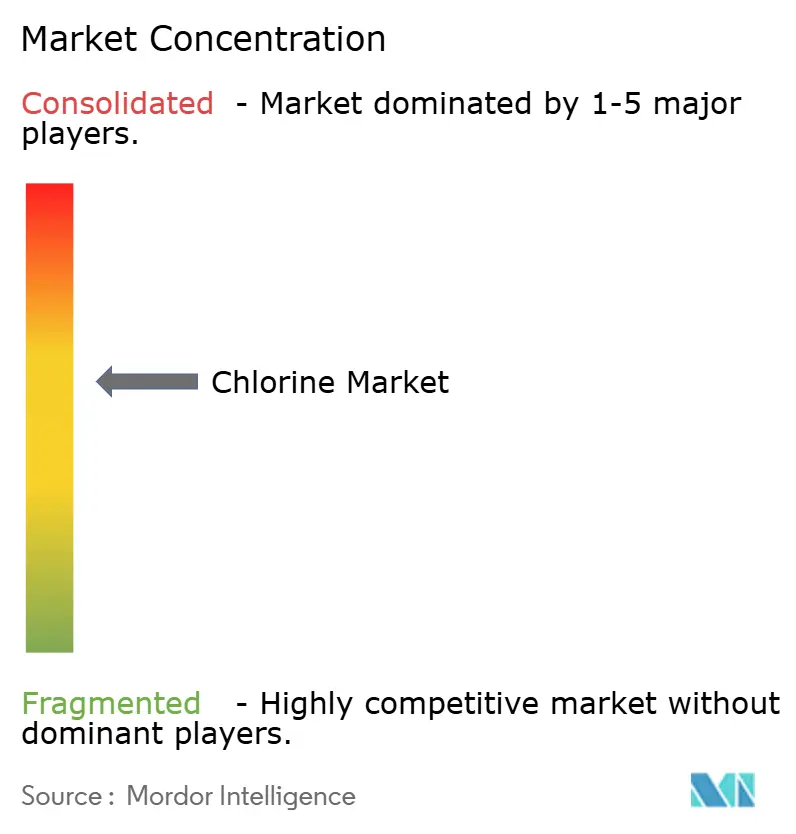
The Chlorine Market is moderately consolidated. Formosa Plastics, Hanwha Solutions, and Westlake maintain integrated PVC chains that buffer margin variability. Pure-play merchants like Nobian face sharper earnings swings tied to caustic pricing, prompting investment into on-site electro-chlorination and specialty-grade purification. Recent structural moves include Olin-Mitsui’s Blue Water Alliance, Arkema’s French plant closure, and Dow’s scheduled German exit, all signalling a shift toward footprint optimization over capacity growth in high-cost regions. Ansa McAL’s USD 327 million purchase of Bleachtech gives it Caribbean scale at a time when merchant volumes are shrinking but service bundling is expanding.
Chlorine Industry Leaders
Formosa Plastics Group
INEOS
Occidental Petroleum Corporation
Olin Corporation
Westlake Corporation
- *Disclaimer: Major Players sorted in no particular order

Market Opportunities and Future Outlook
Investment activity points to two main whitespace areas in the chlorine market, (1) modernization and capacity moves tied to energy-efficient membrane-cell technology and (2) higher-purity and circularity pathways that raise value per ton beyond commodity vinyl exposure. This is reflected in the February 2026 commissioning of AGC Vinythai's expanded chlor-alkali plant at Map Ta Phut, Thailand, using Thyssenkrupp Nucera e-BiTAC v7 electrolyzer technology (reported with 220,000 tons per year of new caustic soda capacity), and in Brazil's post-expansion status at Unipar Carbocloro's Cubatao facility supported by BNDES financing, which together suggest continued replacement and upgrade cycles rather than greenfield-only growth.
Specialty-grade demand creation is also visible. In May 2026, PKC expanded semiconductor-grade high-purity chlorine capacity by 50% to support Samsung Electronics, reinforcing a premium niche alongside semiconductor etchant and battery-grade chloride themes. On the commodity side, opportunities concentrate around integrated vinyl chains and regional self-sufficiency projects such as Chandra Asri's chlor-alkali and EDC project in Indonesia (reported at 50% completion in February 2026). In parallel, the shift toward on-site electro-chlorination and circular reuse, such as OxyChem's June 2025 recovery and reuse of chlorine byproduct at LaPorte, Texas, supports differentiated service models and lower net raw-material intensity for large, compliance-driven end users.
Recent Industry Developments
- July 2026: PPG reported plans to begin construction of an USD 80 million chlorine conversion project in Louisiana, targeting 275,000 tons per year of output. The project points to ongoing capital allocation toward chlor-alkali asset upgrades and conversion work in North America, where reliability and compliance updates can be as important as incremental nameplate capacity.
- September 2025: DCM Shriram Ltd and Aarti Industries Ltd signed a long-term chlorine supply agreement linked to Aarti's new downstream chemicals facility in Zone IV, Jhagadia, Gujarat. The arrangement tightens captive-style supply in India, reducing merchant exposure and supporting downstream chlorinated intermediates ramp-ups tied to domestic manufacturing growth.
- November 2024: ADAMA opened a new membrane-cell chlor-alkali facility in Israel, increasing annual capacity to 40,000 metric tons. The investment supports the continued shift toward membrane technology for efficiency and environmental performance, while expanding local availability of chlorine and caustic for integrated agrochemical and industrial demand.


Research Methodology Framework and Report Scope
Market Definition and Coverage
For this methodology, the market covers merchant and captive chlorine supply that is produced and consumed across major industrial uses. The measurement is physical volume shipped or used within a given year.
Scope exclusions: We exclude downstream value of chlorine-based derivatives (such as PVC or solvents) and count only the chlorine volume itself.
Segmentation Overview
- By Application
- EDC/PVC
- Isocyanates and Oxygenates
- Chloromethanes
- Solvents and Epichlorohydrin
- Inorganic Chemicals
- Other Applications
- By End-user Industry
- Water Treatment
- Pharmaceutical
- Chemicals
- Paper and Pulp
- Plastic
- Pesticides
- Other End-user Industries
- By Geography
- Asia-Pacific
- China
- India
- Japan
- South Korea
- ASEAN Countries
- Rest of Asia-Pacific
- North America
- United States
- Canada
- Mexico
- Europe
- Germany
- United Kingdom
- Italy
- France
- Spain
- NORDIC Countries
- Turkey
- Russia
- Rest of Europe
- South America
- Brazil
- Argentina
- Rest of South America
- Middle-East and Africa
- Saudi Arabia
- South Africa
- Rest of Middle-East and Africa
- Asia-Pacific
Data Validation & Update Cycle
Validation is done through several checks so the model behaves like the real market. We compare outputs against independent signals such as capacity announcements, trade direction by region, and implied operating rates. Unusual jumps are flagged for analyst review before sign-off.
If a variance cannot be explained, we re-contact relevant interviewees and revisit the assumption that caused the swing, often utilization, captive share, or commissioning timing. Reports are refreshed annually, and interim updates are made when major plant events, regulatory shifts, or demand shocks materially change the outlook. Before delivery, an analyst performs a fresh pass across key inputs so clients receive the latest updated view.
Mordor Intelligence's Chlorine Market Estimate Compared With Other Published Estimates
Published market sizes for chlorine can look far apart, even when they appear to describe the same industry, because authors do not always measure the same thing in the same unit. Differences usually come from whether the figure is reported as volume or revenue, whether captive production is counted, and how tightly the definition separates chlorine from its downstream derivatives.
In this study, the total is expressed in tons and follows capacity and utilization logic. Many value-based estimates fold in pricing assumptions and sometimes extend coverage into derivative chains. The spread is also affected by how currency timing and average selling price progression are handled during volatile energy and chlor-alkali cycles, and whether updates reflect recent capacity changes or rely on older base-year conditions.
Benchmark comparison
| Source | Market Size | Gaps in Research Methodology |
|---|---|---|
| Mordor Intelligence | USD 83.98 M (2025) | |
| Global Consultancy A | USD 41.20 B (2024) | Reported in USD revenue terms, which depends heavily on chlorine pricing and energy-linked cost pass-through, and it may also blend chlorine with selected derivative revenues rather than isolating pure chlorine volume. |
| Industry Publisher B | USD 44.18 B (2026) | Defines the market around chlorine gas plus derivatives used in multiple downstream products, so the value pool expands beyond chlorine tons, and the year choice can shift the result when prices and contract resets move. |
The table mostly reflects a unit and scope mismatch, where a ton-based view stays closer to capacity, operating rates, and end-use pull, while a USD view rises and falls with pricing and what is bundled into the definition. By keeping measurement in physical volume and cross-checking utilization and captive shares during updates, the spread is reduced for chlorine, a modeling choice applied by Mordor Intelligence near the end of the process.


Key Questions Answered in the Report
What is the projected volume of the chlorine market by 2031?
Global consumption is forecast to reach 107.06 million tons by 2031.
Which region leads both volume and growth rate?
Asia-Pacific held 64.17% of demand in 2025 and is set to grow at a 4.76% CAGR through 2031.
Which application category currently consumes the most chlorine?
EDC/PVC accounts for 33.42% of uptake, anchoring the bulk of global volume.
Which end-user segment is expanding the fastest?
Water treatment shows the highest 4.66% CAGR owing to expanding municipal infrastructure.
How are environmental regulations influencing production technology?
Mercury-cell units are being retired in favor of membrane-cell lines that deliver higher energy efficiency and regulatory compliance.
What specialty area offers new growth potential?
Battery-grade lithium-metal chloride for solid-state electric-vehicle batteries presents a premium niche with strong long-term prospects.
Page last updated on:






