
Market Overview
| Study Period | 2020 - 2031 |
|---|---|
| Market Size (2026) | USD 2.88 Billion |
| Market Size (2031) | USD 3.56 Billion |
| Growth Rate (2026 - 2031) | 4.32% CAGR |
| Fastest Growing Market | Asia Pacific |
| Largest Market | North America |
| Market Concentration | High |
Major Players *Disclaimer: Major Players sorted in no particular order Image © Mordor Intelligence. Reuse requires attribution under CC BY 4.0. | |
Calcium Peroxide Market Analysis by Mordor Intelligence
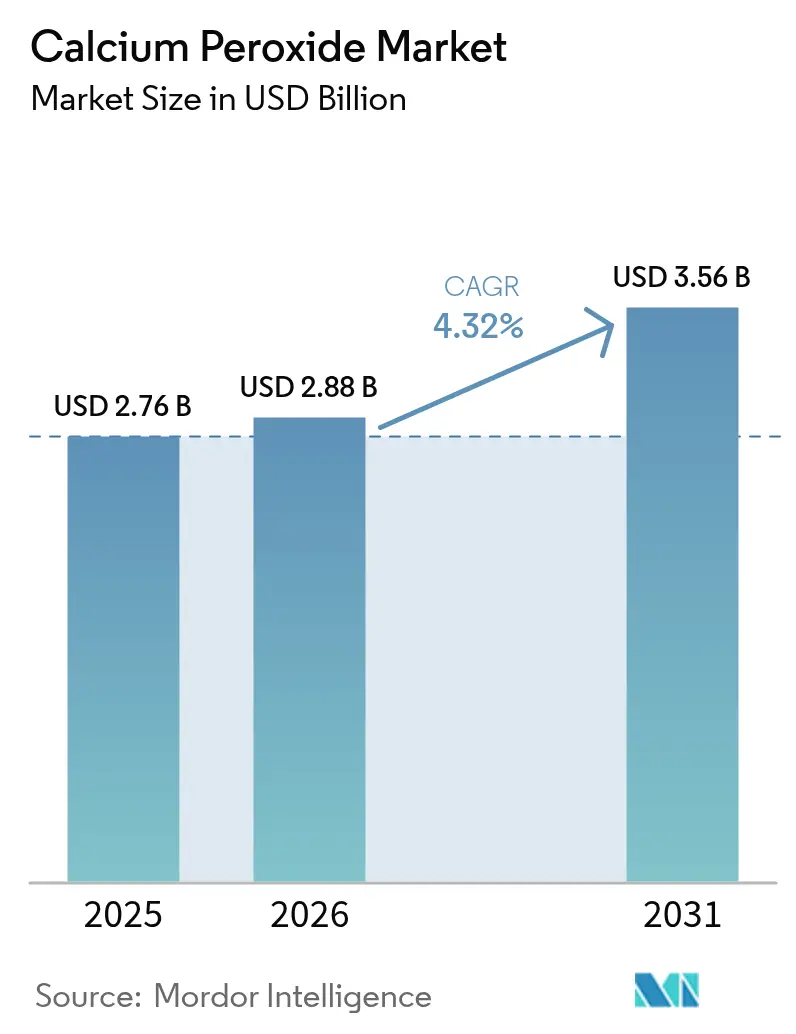
Calcium Peroxide market size in 2026 is estimated at USD 2.88 billion, growing from 2025 value of USD 2.76 billion with 2031 projections showing USD 3.56 billion, growing at 4.32% CAGR over 2026-2031. Current momentum comes from sustained demand for an oxidizing agent that decomposes into calcium hydroxide and oxygen, leaving no hazardous by-products. Growth levers include large-scale adoption in dough conditioning, expanding environmental remediation projects, and wider use in seed pelleting for precision agriculture. Competitive activity centers on application-specific formulations that shorten processing cycles, improve water quality, or raise germination rates while meeting strict regulatory standards. Producers also hedge against feedstock price swings by vertical integration and regional capacity additions. Risks relate to handling hazards, volatile lime and calcium carbonate costs, and substitution pressure from lower-priced peroxides.
Key Report Takeaways
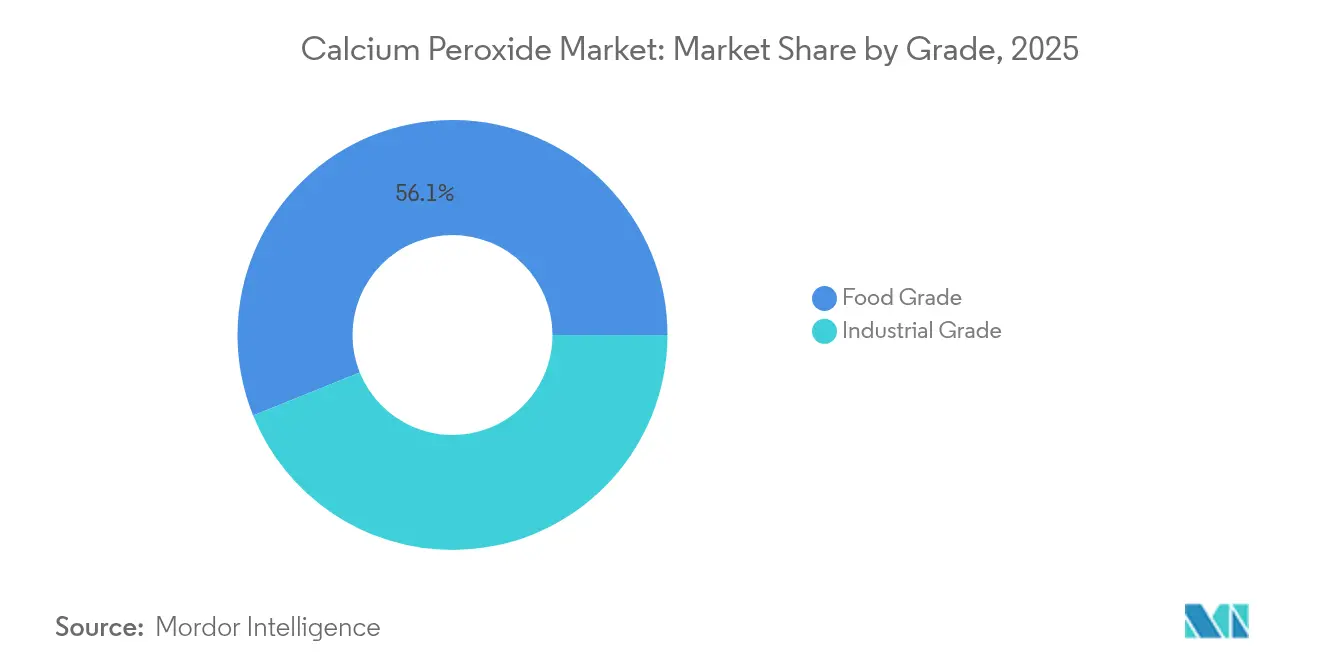
- By grade, Food Grade led with 56.10% revenue share in 2025; Industrial Grade is projected to expand at 4.98% CAGR to 2031.
- By application, Oxidizing Agent accounted for 34.00% of the calcium peroxide market share in 2025, while Seed Disinfectant is forecast to advance at 5.72% CAGR through 2031.
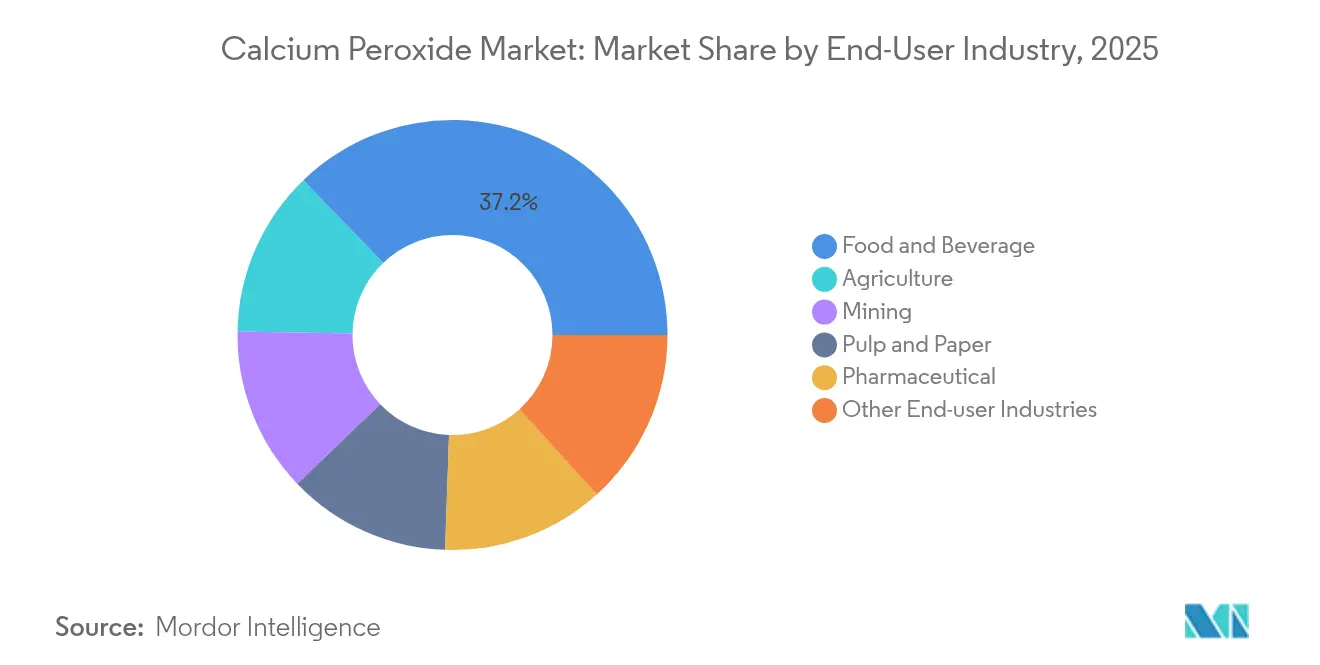
- By end-user industry, Food & Beverage commanded 37.20% share of the calcium peroxide market size in 2025, and Agriculture is projected to grow at 6.05% CAGR between 2026 and 2031.
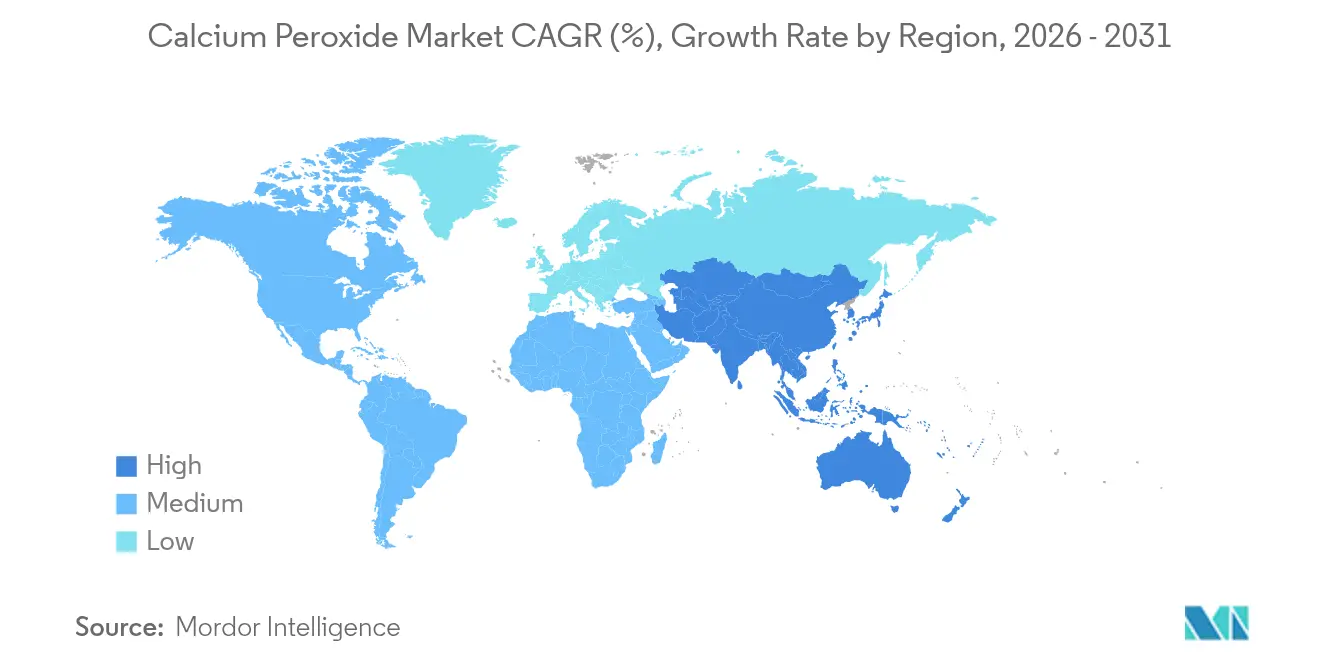
- By geography, North America held 37.75% revenue share in 2025; Asia Pacific is expected to climb at 5.96% CAGR to 2031.
Note: Market size and forecast figures in this report are generated using Mordor Intelligence’s proprietary estimation framework, updated with the latest available data and insights as of 2026.
Global Calcium Peroxide Market Trends and Insights
Drivers Impact Analysis*
| Driver | (~) % Impact on CAGR Forecast | Geographic Relevance | Impact Timeline |
|---|---|---|---|
| Increased use as dough-conditioner in bakery industry | +1.20% | Global, with concentration in North America & Europe | Medium term (2-4 years) |
| Growing adoption in oral-care & dental whitening products | +0.80% | North America, Europe, Asia Pacific urban centers | Short term (≤ 2 years) |
| Rising demand for in-situ soil & groundwater remediation | +1.00% | North America, Europe, with expansion to Asia Pacific | Long term (≥ 4 years) |
| Expansion of seed-pelleting for precision agriculture | +0.90% | Asia Pacific core, spill-over to Latin America | Medium term (2-4 years) |
| Aquaculture pond-oxygenation technologies gaining traction | +0.40% | Asia Pacific, particularly Japan and Southeast Asia | Medium term (2-4 years) |
| Europe phase-down of azodicarbonamide drives peroxide alternatives | +0.20% | Europe, with regulatory influence in other regions | Short term (≤ 2 years) |
| Source: Mordor Intelligence | |||
Increased Use as Dough-Conditioner in Bakery Industry
Demand for calcium peroxide in industrial bakeries rises as no-time dough processes replace traditional proofing. Optimum addition rates of 20-35 ppm improve gluten strength, moisture retention, and frozen dough stability, helping large bakers standardize quality across plants. Regulatory bans on azodicarbonamide in Europe further favour the compound because its breakdown products pose minimal health risks[1]Publications Office of the European Union, “Commission Regulation on Food Additives,” publications.europa.eu . Production scale-up in North America and Europe secures a consistent supply for multinational food groups. Greater consumption of frozen and par-baked items in retail channels sustains long-term volume growth for the calcium peroxide market. Equipment upgrades that integrate inline oxidant dosing also streamline adoption.
Growing Adoption in Oral-Care & Dental Whitening Products
Nanoparticle grades are gaining traction in tooth whitening gels and mouthwashes because slow oxygen release inhibits biofilms while brightening enamel. Clinical studies show better penetration into dentinal tubules than hydrogen peroxide, reducing sensitivity. Major oral-care brands position calcium peroxide as a “gentle oxygen” ingredient, aligning with clean-label trends. Rapid urbanisation in the Asia Pacific widens the consumer base for premium whitening products, adding near-term demand. Regulatory approvals across the United States, European Union, and Japan smooth commercialisation for both OTC and professional lines.
Rising Demand for In-Situ Soil & Groundwater Remediation
Environmental regulations that force industrial site clean-ups boost the adoption of solid calcium peroxide for modified Fenton treatments. Controlled hydrogen peroxide release works effectively at pH 8, cuts handling risks, and reduces truck movements versus liquid oxidants. Longer persistence in the subsurface means fewer injections, lowering total remediation costs. North American Superfund initiatives and European brownfield redevelopment programmes underpin sustained volumes. Asia Pacific nations now mandate remediation of petrochemical clusters, widening the addressable calcium peroxide market through 2030.
Expansion of Seed Pelleting for Precision Agriculture
Direct-seeded rice adoption in China, India, and Southeast Asia stimulates use in pelleting blends where a 0.6:1–1:1 ratio of calcium peroxide to seed boosts emergence under flooded soils. Oxygen release accelerates α-amylase activity and suppresses anaerobic fermentation, giving seedlings a vigour advantage. Field trials report 85% emergence versus 55% in untreated plots, with favourable benefit-cost ratios[2]Sustainability Journal, “Direct-Seeded Rice Pelleting Study,” sustainability-journal.org . Rising labour costs and water scarcity push growers toward mechanised direct seeding, making the technology mainstream by 2030. Formulators develop dust-free micro-granules compatible with pneumatic equipment, sharpening the competitive edge of the calcium peroxide market.
Restraints Impact Analysis*
| Restraint | (~) % Impact on CAGR Forecast | Geographic Relevance | Impact Timeline |
|---|---|---|---|
| Health & safety hazards during storage/handling | -0.70% | Global, with stricter enforcement in developed markets | Short term (≤ 2 years) |
| Substitution threat from cheaper hydrogen/benzoyl peroxides | -0.50% | Global, particularly in price-sensitive applications | Medium term (2-4 years) |
| Volatile lime & calcium carbonate feedstock pricing | -0.30% | Global, with regional variations in raw material costs | Short term (≤ 2 years) |
| Source: Mordor Intelligence | |||
Health & Safety Hazards During Storage/Handling
Calcium peroxide is classified as a strong oxidizer; contact with organics can intensify fires, and the dust irritates eyes, skin, and respiratory tracts[3]New Jersey Department of Health, “Hazardous Substance Fact Sheet: Calcium Peroxide,” nj.gov. Warehouses require isolation from combustible materials, temperature control, and local exhaust ventilation systems. These measures raise compliance costs, especially for small processors in emerging markets. Absence of an established occupational exposure limit adds regulatory uncertainty and may delay plant approvals. Training and personal protective equipment requirements also elevate the total cost of ownership, restraining rapid diffusion in cost-conscious segments of the calcium peroxide market.
Volatile Lime & Calcium Carbonate Feedstock Pricing
Lime and precipitated calcium carbonate prices fluctuate with energy costs and limestone availability, directly influencing calcium peroxide production cost. Sudden spikes in natural gas or coal prices can compress processor margins and trigger pass-through price hikes. Contracts in Asia Pacific often include cost-plus clauses, transferring volatility to end-users. Regional sourcing strategies and captive limestone quarries moderate exposure but add capital intensity that discourages new entrants, shaping the competitive contours of the calcium peroxide market.
*Our forecasts treat driver/restraint impacts as directional, not additive. The impact forecasts reflect baseline growth, mix effects, and variable interactions.
Segment Analysis
By Grade: Food Grade Dominance Drives Market Stability
Food Grade accounted for 56.10% of the calcium peroxide market share in 2025, reflecting entrenched demand from global bakery groups that require consistent oxidant performance under strict food safety codes. Premium suppliers deliver products that conform to FCC and ASTM benchmarks and maintain a narrow particle-size span, enabling homogeneous dispersion in high-speed mixers. Industrial Grade is forecast to post a 4.98% CAGR to 2031 as soil remediation, aquaculture, and precision agriculture gain scale. Specialty nanoparticle variants aimed at oral-care and pharmaceutical uses command higher margins, attracting R&D investments from chemical majors.
Regulatory audits in North America and Europe reinforce supplier selection criteria, favouring long-standing producers with validated hazard-analysis plans. Meanwhile, Industrial Grade formulators emphasise oxygen yield, water insolubles, and flowability to meet remediation contractors’ dosing equipment requirements. Adoption of direct-seeded rice and pond treatment in Asia Pacific underpins sustained tonnage growth for Industrial Grade. The interplay of stringent certification on one side and performance customisation on the other maintains overall balance and undergirds long-term resilience of the calcium peroxide market.



By Application: Oxidizing Agent Leadership Faces Seed Disinfectant Challenge
Oxidizing Agent remained the largest application with 34.00% share in 2025, supported by industrial wastewater treatment, soil oxidation, and chemical synthesis. Nevertheless, Seed Disinfectant is projected to register the fastest 5.72% CAGR through 2031 as rice, maize, and vegetable seeds in Asia Pacific and Latin America adopt pelleting that embeds oxygen donors. Performance metrics such as germination rate and early vigour underpin quick commercial payback, driving adoption even among smallholders.
Dough Conditioning continues to secure volumes in North American frozen-dough lines and European artisanal bread chains, whereas bleaching uses in pulp and textile face cost-driven substitution by liquid peroxide. Niche intermediary chemical syntheses rely on calcium peroxide as a stable oxygen precursor, though volumes remain modest. Growth dynamics therefore rest on the balance between mature oxidation niches and emergent agricultural innovations that enlarge the addressable calcium peroxide market.
By End-User Industry: Agriculture Acceleration Challenges Food & Beverage Dominance
Food & Beverage held 37.20% of the calcium peroxide market size in 2025, underpinned by global bakery consolidation and rising frozen dough exports. The sector values predictable functional performance and regulatory clarity, which entrenches calcium peroxide usage. Agriculture, however, is on track for a 6.05% CAGR through 2031, fuelled by direct-seeded rice, high-value horticulture, and sustainable soil management policies across Asia Pacific and South America.
Mining operations deploy calcium peroxide for ore oxidation and pit-lake water conditioning, while Pulp & Paper plants in remote regions prefer solid oxidants that sidestep bulk liquid storage. Pharmaceutical and oral-care innovators formulate micro-encapsulated grades to marry whitening with antimicrobial effects, creating premium micro-niches. The wide spread of end-use domains mitigates cyclical exposure and helps stabilise overall pricing in the calcium peroxide market.
Geography Analysis
North America led with a 37.75% revenue share in 2025 thanks to stringent remediation legislation, a technologically advanced bakery sector, and early deployment of precision seeding tools that favour calcium peroxide-based oxygen donors. The United States Environmental Protection Agency’s brownfield grants continue to stimulate demand for solid-form oxidants that lower site operation hazards. Canada follows with resource-sector soil clean-up and aquaculture trials in British Columbia, while Mexico benefits from food-processing exports that hinge on US supply chains. Capacity additions in hydrogen peroxide plants, such as Engro’s investment that feeds downstream calcium peroxide production, enhance raw material security.
Asia Pacific posts the fastest regional CAGR at 5.96% to 2031, propelled by large-scale aquaculture operations and direct-seeded rice adoption. Japanese eel farms and Vietnamese shrimp ponds illustrate the breadth of pond-oxygenation uses, driving recurring monthly demand. China’s contaminated-land restoration mandates, India’s mechanised rice planters, and South Korea’s oral-care innovation ecosystem all expand application diversity. Regional manufacturers in China and Malaysia commission new plants close to limestone deposits to trim logistics costs and shorten delivery cycles, reinforcing competitiveness of the calcium peroxide market in the region.
Europe’s trajectory is shaped by the phased withdrawal of azodicarbonamide from bakery lines, pushing bakeries in Germany, France, and the United Kingdom toward calcium peroxide alternatives. Soil remediation in old industrial belts of Poland and Italy presents additional volume. Northern Europe’s high-value aquaculture sector pilots sediment oxidation regimes, adding another use case. South America and the Middle East & Africa provide emerging potential, with Brazil’s Cerrado reclamation and Egypt’s tilapia ponds drawing on technology transfer from Asia Pacific. Infrastructure gaps and regulatory variability temper the growth slope yet still feed incremental tonnage into the global calcium peroxide market.

Value Chain Analysis
The calcium peroxide value chain starts with upstream feedstocks, primarily calcium hydroxide (milk of lime) derived from limestone and hydrogen peroxide, followed by controlled synthesis where calcium hydroxide reacts with hydrogen peroxide. Producers use stabilizers and process controls to manage the exothermic reaction and reach target oxygen yield and particle characteristics. Integrated peroxide producers and specialty oxidant suppliers help secure downstream calcium peroxide supply, while branded environmental grades (for example, Evonik's PERMEOX line) focus on slow oxygen release performance and safe handling attributes.
Midstream activities include grade qualification (food versus industrial), milling and particle-size control, and oxidizer-safe packaging for logistics. Downstream distribution typically involves chemical distributors and direct supply to industrial bakeries, remediation contractors, seed-treatment and pelleting formulators, and aquaculture-input suppliers, supported by handling and dosing guidance. Cost and bottleneck pressure tends to concentrate around hydrogen peroxide availability and pricing, lime and calcium carbonate volatility, and compliance-driven warehousing and transport requirements for oxidizers, which can widen the delivered-cost gap versus cheaper substitute peroxides in price-sensitive applications.
Competitive Landscape
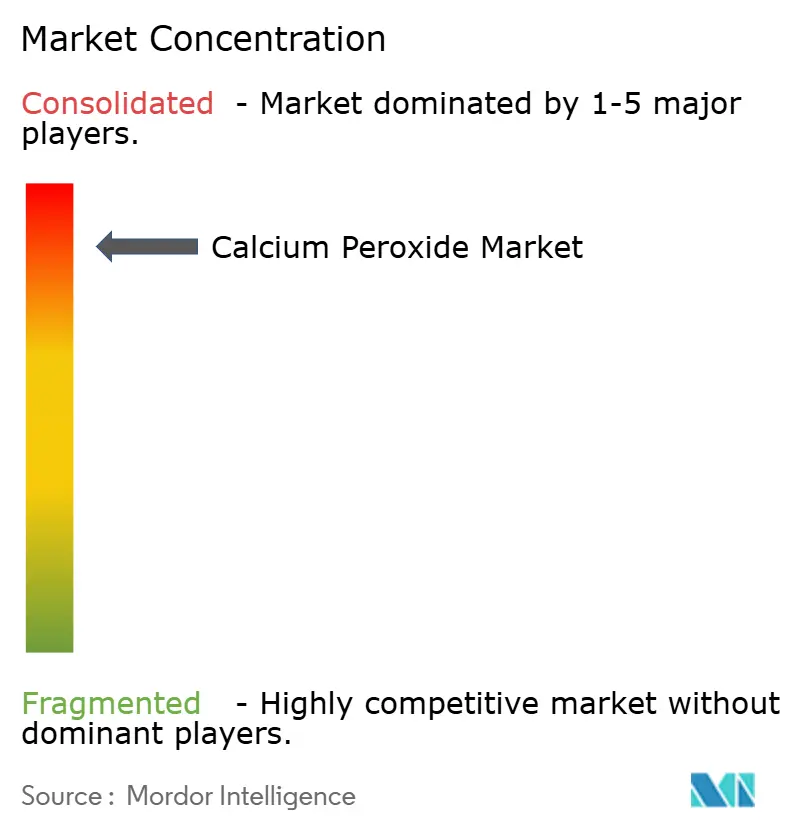
The calcium peroxide market remains highly consolidated. Evonik and Solvay leverage integrated hydrogen peroxide streams and global distribution networks to supply food and remediation grades efficiently. Carus Group and American Elements emphasise specialty formulations, including high-surface-area powders tailored for modified Fenton chemistry. Regional players in China and Southeast Asia build capacity close to limestone resources to reduce freight and maintain price competitiveness.
Strategic investment focuses on nanoparticle synthesis, encapsulation, and custom blends that marry calcium peroxide with micronutrients or microbial inoculants for agriculture. Dow and Evonik’s HYPROSYN pilot in Germany, which transforms hydrogen peroxide into propylene glycol with 95% less water, illustrates the broader corporate push toward circular peroxide chemistry, indirectly bolstering calcium peroxide upstream integration. Producers also secure feedstock through long-term limestone and natural gas contracts, buffering margin risk when energy prices swing.
Mergers and partnerships target geographic expansion. A recent alliance between a Japanese specialty chemical firm and a Thai aquaculture feed company aims to co-market calcium peroxide pond blocks, combining formulation know-how with channel access. Product stewardship programmes, including client training and safety audits, help larger incumbents differentiate in markets where handling hazards remain a buyer concern. Overall, innovation speed, safe logistics, and regulatory compliance form the decisive competitive factors steering the calcium peroxide market.
Calcium Peroxide Industry Leaders
Carus Group Inc.
Evonik Industries AG
Shangyu Jie Hua Chemical
Solvay SA
Zhengzhou Huize Biochemical Technology Co. Ltd
- *Disclaimer: Major Players sorted in no particular order

Market Opportunities and Future Outlook
The clearest near-term opportunity is for engineered, application-specific calcium peroxide formats that reduce dusting, improve flowability, and provide more controlled oxygen-release curves for field use. In agriculture, direct-seeded rice and stress-mitigation use cases (waterlogging and acidic soils) remain central, and recent peer-reviewed work continues to document agronomic and soil-microbiome impacts from calcium peroxide application. That evidence supports value-added blends that pair oxygen donors with micronutrients, carriers, or microbial inoculants. Differentiation can also extend to aquaculture pond-oxygenation blocks and granules, where repeat-use regimes favor suppliers that standardize oxygen delivery while meeting local safety and transport constraints.
Environmental remediation also supports demand for solid-state oxidants, where logistics can be simpler than liquid hydrogen peroxide in Fenton-type and in-situ oxidation approaches. Continued research on treating persistent organic pollutants in soil and groundwater supports calcium peroxide as a controlled source of reactive oxygen. On the supply side, sustainability-linked raw materials and integrated peroxide value chains provide another lever, including Evonik's provision of carbon-neutral hydrogen peroxide to customers across Europe, which acts as an upstream input for calcium peroxide production and supports emissions-focused procurement requirements for buyers with Scope 3 reduction targets.
Recent Industry Developments
- January 2026: Evonik continued to commercialize calcium peroxide under its Active Oxygens portfolio, positioning grades for environmental applications that require controlled oxygen release (PERMEOX range). The emphasis on application-specific performance and stewardship aligns with buyer needs in remediation projects where dosing efficiency and safe handling affect total project cost.
- February 2025: Dow and Evonik launched a HYPROSYN pilot plant in Hanau, Germany, converting hydrogen peroxide into propylene glycol. The initiative strengthens hydrogen peroxide process integration and infrastructure know-how, which supports upstream resilience for peroxide-based value chains used in calcium peroxide production.
- April 2024: Evonik began supplying certified carbon-neutral hydrogen peroxide to customers across Europe. Since hydrogen peroxide is a critical input for calcium peroxide manufacturing, the program enables downstream products to support emissions-focused procurement requirements and differentiates suppliers serving regulated and sustainability-driven customers.


Research Methodology Framework and Report Scope
Market Definition and Coverage
For this study, the market is defined as the value of calcium peroxide sold as a chemical product across end-use applications where it is used mainly as an oxidizing or oxygen-releasing agent, and it is measured in revenue terms.
Scope exclusions: We exclude hydrogen peroxide and other peroxide substitutes, and we also exclude any downstream products where calcium peroxide is only a minor ingredient and not sold as calcium peroxide.
Segmentation Overview
- By Grade
- Food Grade
- Industrial Grade
- By Application
- Dough Conditioner
- Seed Disinfectant
- Bleaching Agent
- Oxidizing Agent
- Intermediary Chemicals
- Other Applications
- By End-user Industry
- Food and Beverage
- Agriculture
- Mining
- Pulp and Paper
- Pharmaceutical
- Other End-user Industries
- By Geography
- Asia-Pacific
- China
- India
- Japan
- South Korea
- Rest of APAC
- North America
- United States
- Canada
- Mexico
- Europe
- Germany
- United Kingdom
- France
- Italy
- Rest of Europe
- South America
- Brazil
- Argentina
- Rest of South America
- Middle East and Africa
- Saudi Arabia
- South Africa
- Rest of Middle East and Africa
- Asia-Pacific
Data Validation & Update Cycle
Validation happens in layers, so the model is not accepted just because the math works. Analysts compare the market totals against independent signals such as trade movement, typical capacity utilization narratives, and price direction, then large variances are reviewed until a clear explanation is documented.
Before sign-off, the work is reviewed by another analyst to confirm that the logic, units, and conversions are consistent across regions and applications. If a major gap shows up, or if a respondent flags a structural change like a new capacity build or a demand shock, we re-contact sources and rerun the impacted parts of the model. Reports are refreshed annually, with interim updates for material events, and a final pre-delivery pass is completed so clients receive the latest aligned view.
Mordor Intelligence's Calcium Peroxide Market Size Versus Other Published Estimates
It is normal to see different published market sizes for calcium peroxide, even when they all refer to the same chemical. The differences usually come from what is being counted as revenue, which year is treated as the current base, and how prices are carried forward during the forecast.
Some published estimates describe a factory-gate view or include adjacent demand labels, such as clarifying and deodorizing agent sales across channels, but Mordor Intelligence counts revenue for calcium peroxide as a product across its defined grades and applications and does not extend the total to substitute peroxides or bundled downstream formulations.
Benchmark comparison
| Source | Market Size | Gaps in Research Methodology |
|---|---|---|
| Mordor Intelligence | USD 2.88 B (2026) | |
| Global Market Report A | USD 2.94 B (2023) | Uses an ex-factory, factory-gate framing and a different base year, and its scope language leans toward sales definitions that can shift totals when channel markups and included services are treated differently. |
| Industry Publisher B | USD 2.37 B (2024) | Shows a lower current-year value that likely reflects a different price normalization and adoption pace assumptions by region, with limited clarity on how grade-level pricing and application intensity were validated. |
Across the three figures, the spread is mainly explained by base-year choice and what gets counted as in-scope revenue, followed by how pricing is moved forward. By anchoring the estimate to clear use-driven demand indicators, then cross-checking it with practical price and channel signals, we keep the result traceable and easier to replicate.


Key Questions Answered in the Report
What is driving the growth of the calcium peroxide market?
The chief drivers are expanding food-grade demand in industrial bakeries, rising adoption in soil and groundwater remediation, and rapid uptake in seed pelleting for direct-seeded rice and other precision agriculture practices.
Which grade segment leads the calcium peroxide industry?
Food Grade leads with 56.10% of 2025 revenue, supported by strict food safety standards and established supply contracts with large bakery groups.
How fast is the agriculture end-user segment growing?
Agriculture applications are forecast to advance at a 6.05% CAGR between 2026 and 2031, outperforming the overall market due to field-level benefits in germination and soil oxygenation.
Which region shows the highest growth potential?
Asia Pacific is projected to grow at 5.96% CAGR through 2031, supported by aquaculture expansion and direct-seeded rice adoption.
What are the main restraints hindering market expansion?
Handling hazards, volatile feedstock prices, and the availability of cheaper hydrogen or benzoyl peroxides pose the primary challenges.
What is the current market size of calcium peroxide market in 2026?
The Calcium Peroxide Market size is estimated at USD 2.88 billion in 2026, and is expected to reach USD 3.56 billion by 2031, at a CAGR of 4.32% during the forecast period (2026-2031).
Page last updated on:






