
Bisphenol A (BPA) Market Size and Share
Market Overview
| Study Period | 2021 - 2031 |
|---|---|
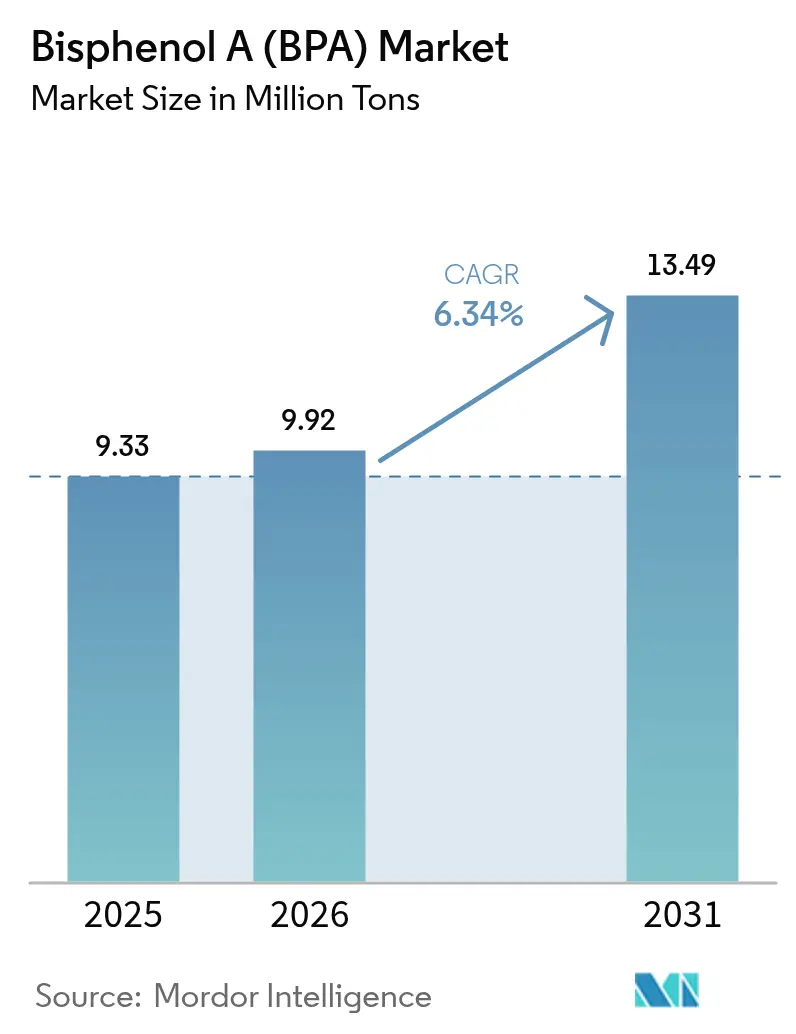
| Market Volume (2026) | 9.92 Million tons |
| Market Volume (2031) | 13.49 Million tons |
| Growth Rate (2026 - 2031) | 6.34% CAGR |
| Fastest Growing Market | Asia Pacific |
| Largest Market | Asia Pacific |
| Market Concentration | Medium |
Major Players *Disclaimer: Major Players sorted in no particular order Image © Mordor Intelligence. Reuse requires attribution under CC BY 4.0. | |
Bisphenol A (BPA) Market Analysis by Mordor Intelligence
The Bisphenol A Market size was valued at 9.33 million tons in 2025 and is estimated to grow from 9.92 million tons in 2026 to reach 13.49 million tons by 2031, at a CAGR of 6.34% during the forecast period (2026-2031). Polycarbonate continues to anchor volume because its impact strength, clarity, and flame retardancy are valued in consumer electronics and automotive glazing. Feedstock-cost gaps between Asia-Pacific and the West are widening, so integrated Chinese producers enjoy stronger cash margins than North American and European peers. Wind-energy rollout and aerospace composites are lifting epoxy-resin demand, giving high-purity BPA grades a growth pocket that is insulated from food-contact regulation. At the same time, closed-loop depolymerization pilots in Texas and Europe hint at future secondary supply streams that could temper virgin capacity needs without curbing overall Bisphenol A market momentum.
Key Report Takeaways
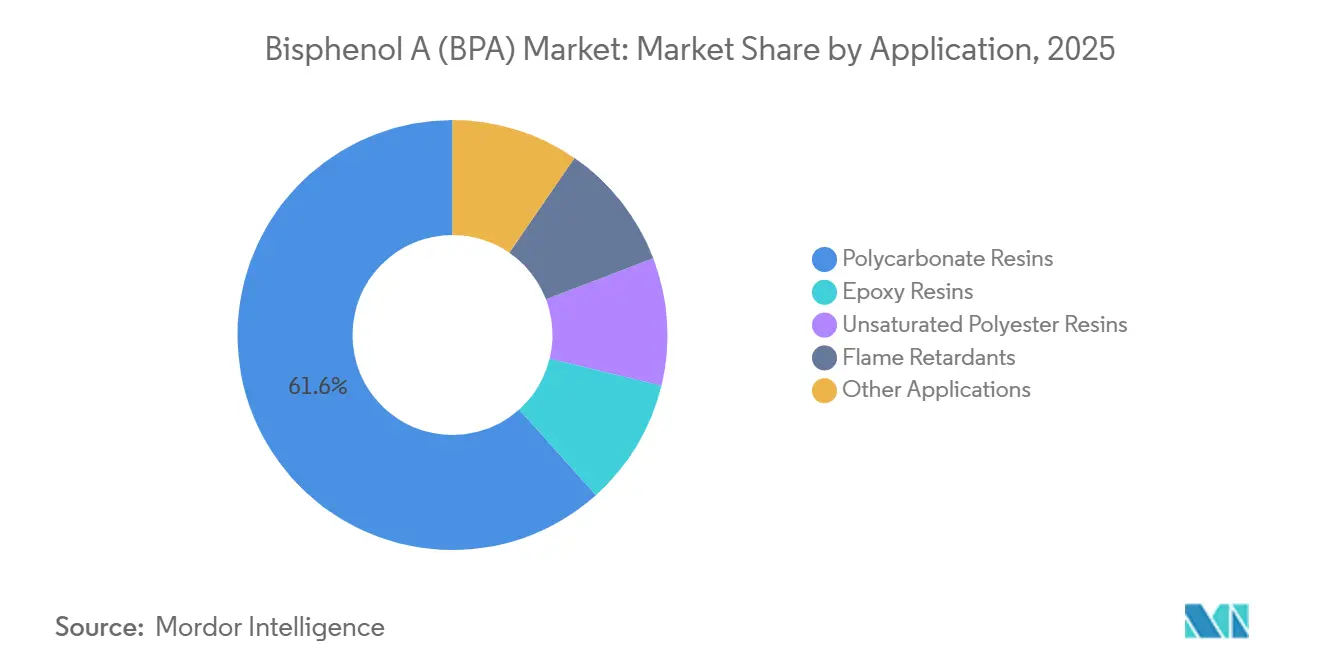
- By application, polycarbonate resins commanded 61.62% of the Bisphenol-A market share in 2025, whereas epoxy resins are forecast to expand at a 6.44% CAGR through 2031.
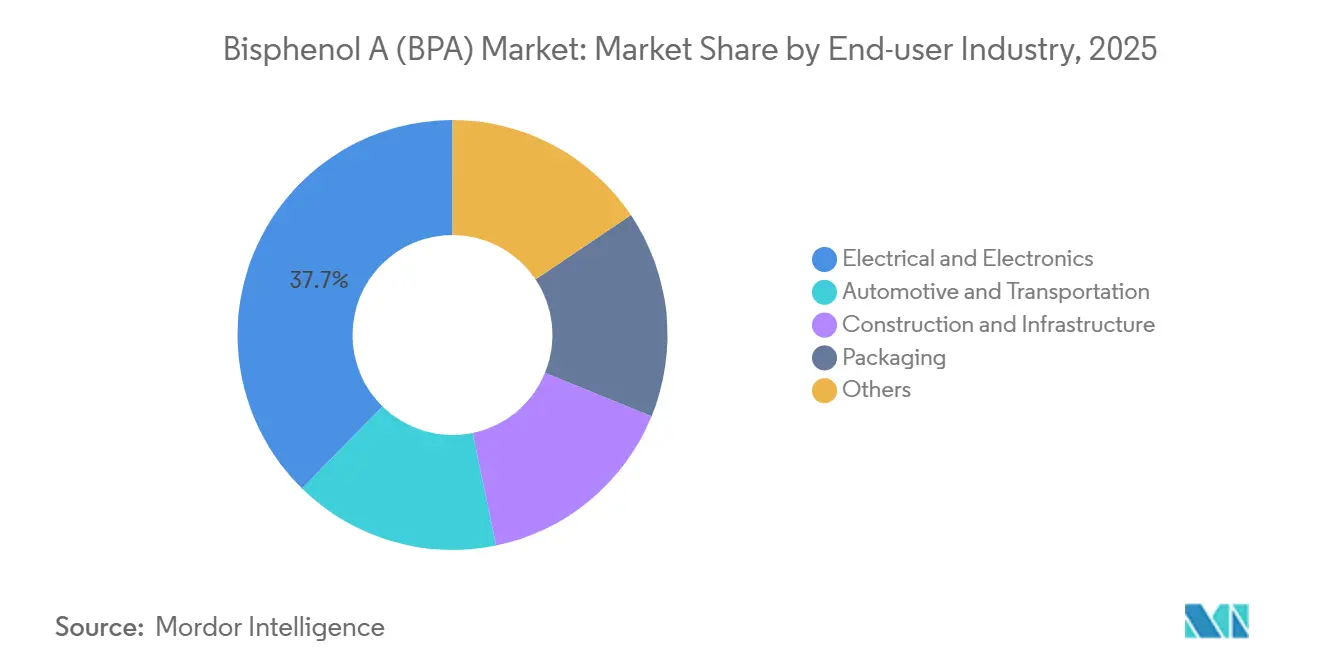
- By end-user industry, electrical and electronics captured 37.66% of the Bisphenol-A market size in 2025 and is advancing at a 6.55% CAGR between 2026 and 2031.
- By geography, Asia-Pacific captured 63.10% of the market and is advancing at a CAGR of 7.32% through 2031.
Note: Market size and forecast figures in this report are generated using Mordor Intelligence’s proprietary estimation framework, updated with the latest available data and insights as of 2026.
Global Bisphenol A (BPA) Market Trends and Insights
Drivers Impact Analysis*
| Driver | (~) % Impact on CAGR Forecast | Geographic Relevance | Impact Timeline |
|---|---|---|---|
| Growth in epoxy-resin demand for wind-turbine blades | +1.2% | Europe, North America, APAC coastal regions | Medium term (2-4 years) |
| Asia-Pacific capacity additions lowering unit costs | +2.1% | APAC core, spill-over to Middle East & Africa | Short term (≤ 2 years) |
| Aerospace-grade BPA derivatives for advanced composites | +0.8% | North America, Europe | Long term (≥ 4 years) |
| Continuous-flow phenol–acetone integration boosting margins | +0.9% | Global, led by integrated producers in APAC | Medium term (2-4 years) |
| Closed-loop BPA depolymerization and upcycling technologies gain traction | +0.6% | Europe, North America | Long term (≥ 4 years) |
| Source: Mordor Intelligence | |||


Growth in Epoxy-Resin Demand for Wind-Turbine Blades
Wind-energy expansion is pulling high-performance epoxy resins into blades exceeding 100 m in length, and each blade contains several hundred kilograms of BPA-derived resin. Europe’s offshore installations consumed about 24,000 tons of such epoxy in 2025, and volumes rise as coastal permitting accelerates[1]European Composites Industry Association, “Offshore Wind Blade Growth,” european-composites.eu. The superior adhesion, chemical resistance, and fatigue life of BPA-based epoxy meet blade-longevity targets that determine the levelized cost of energy. Similar property sets are driving adoption within nacelle covers and spar caps. As the renewable-energy supply chain emphasizes durability over cost alone, integrated BPA suppliers gain stable offtake that is largely insulated from food-contact bans. In parallel, aerospace programs keep epoxy demand on a steady trajectory, though long certification cycles push the bulk of lift past 2028.
Asia-Pacific Capacity Additions Lowering Unit Costs
New plants in mainland China added 696,000 t/y of nameplate capacity during 1H-2024, putting downward pressure on global contract prices. These sites sit next to cumene and phenol-acetone hubs, cutting logistics outlays and working capital. Western producers with older, smaller reactors face higher fixed costs, so North American phenol assets ran at only 55-60% through 2025. The margin gap forces some to exit merchant BPA and pivot toward specialty derivatives. Additional captive units that support Chinese polycarbonate lines will shrink merchant trade further, crowding exporters from high-cost geographies and reshaping Bisphenol A market trade flows.
Aerospace-Grade BPA Derivatives for Advanced Composites
Ultra-pure BPA supports epoxy systems with glass-transition temperatures above 180°C, a threshold that bio-based candidates have yet to match. Hydrogenated BPA (HBPA) for electronics packaging stood at USD 23.5 million in 2024 and could reach USD 37.3 million by 2032 as higher thermal budgets enter semiconductor roadmaps. Aerospace qualification periods of three to five years lock suppliers into long revenue tails, encouraging R&D spend on next-generation grades. These high-margin niches shield a fragment of the Bisphenol A market from commodity cycles and make the segment attractive to companies seeking differentiation.
Continuous-Flow Phenol–Acetone Integration Boosting Margins
Continuous-flow technology optimizes residence time and heat removal better than batch reactors, lifting overall yield and cutting energy intensity by 5-8%. Plant operators who design flow reactors into new builds gain flexibility to pivot between BPA and other phenolic derivatives when spreads shift. Because Asia-Pacific greenfield sites start with a blank slate, they capture these benefits first. Western plants evaluating retrofits face downtime risk and higher capex, widening the structural cost gulf that defines competitiveness in the Bisphenol A market.
Restraints Impact Analysis*
| Restraint | (~) % Impact on CAGR Forecast | Geographic Relevance | Impact Timeline |
|---|---|---|---|
| Phenol and acetone feedstock price volatility | -1.4% | Global, acute in North America & Europe | Short term (≤ 2 years) |
| Anti-dumping duties on Asian BPA exports | -0.7% | Europe, North America | Medium term (2-4 years) |
| Rapid adoption of BPA-free resins in critical electronics | -0.9% | Europe, North America, Japan | Medium term (2-4 years) |
| Source: Mordor Intelligence | |||
Phenol and Acetone Feedstock Price Volatility
North American phenol averaged USD 902/t in Q4-2025 versus Asia-Pacific at USD 728/t, a gap that spurred arbitrage cargoes and drove spot volatility above 20%. Because BPA absorbs most phenol cost, polycarbonate sellers struggled to secure long-term contracts, and automotive OEMs moved toward fixed-price deals that shift risk back to resin suppliers. Non-integrated producers trimmed rates, leaving assets at 55-60% utilization. Upstream benzene remains tied to crude swings, so feedstock shocks can ripple through the Bisphenol A market within weeks.
Anti-Dumping Duties on Asian BPA Exports
The EU set definitive duties of 17.3–33% on Chinese BPA-based epoxy resin in July 2025, lifting landed cost by up to USD 300/t. While the move temporarily supports European margins, downstream compounders pay more for input, eroding export competitiveness. Registration rules added in October 2024 prolong customs clearance times and favor incumbents with compliance teams. Should the United States replicate EU protection by late 2026, global trade lanes for the Bisphenol A market will fragment further, increasing regional self-sufficiency and possible overbuild by 2029.
*Our forecasts treat driver/restraint impacts as directional, not additive. The impact forecasts reflect baseline growth, mix effects, and variable interactions.
Segment Analysis
By Application: Polycarbonate Dominance Masks Epoxy’s Faster Path
Polycarbonate occupied 61.62% of the Bisphenol A market size in 2025, reflecting entrenched use in LED lenses, smartphone casings, and lightweight vehicle glazing[2]Mitsubishi Chemical Group, “Polycarbonate Market Applications,” mitsubishi-chem.co.jp. Price swings of 18-22% during 2025, however, encouraged automakers to test polycarbonate-ABS blends that lower BPA intensity without sacrificing impact performance. Even with these dilution tactics, global EV platforms rely on clear, tough glazing to cut mass, sustaining polycarbonate demand through 2031. Epoxy resin, by contrast, started from a smaller base but is forecast to outpace the overall Bisphenol A market at 6.44% CAGR, buoyed by wind-turbine blades and aerospace composites. Each offshore blade integrates hundreds of kilograms of resin, and blade lengths rising beyond 100 m lock in multi-decade service cycles that stabilize volume. Together, these two products will continue to represent more than four-fifths of the Bisphenol A market share during the outlook period.
Other applications, including flame-retardant tetrabromobisphenol A, unsaturated polyester resins, and specialty coatings, hold niche but profitable positions. Tetrabromobisphenol A dominates printed-circuit-board safety formulations where halogen-free substitutes weaken ignition resistance. Biomass-derived BPA under joint development by Mitsui Chemicals and Teijin could enter pilot scale by 2028, yet cost parity remains elusive. Collectively, these smaller outlets ensure demand diversity, but they lack the scale to counterbalance any future decline in commodity polycarbonate should substitution accelerate in consumer goods.


By End-User Industry: Electronics Lead While Automotive Quickens
Electrical and electronics absorbed 37.66% of global BPA volume in 2025 and are projected to expand at a 6.55% CAGR through 2031. Feature-rich devices and data-center hardware require tighter tolerances, pushing high-purity polycarbonate and epoxy laminates that command 20-30% premiums over commodity grades. Hydrogenated BPA meets moisture-resistance benchmarks in semiconductor encapsulation and represents about 40% of the HBPA sub-segment. Even as smartphone unit sales plateau, advanced form factors like foldables and augmented-reality headsets lift per-device resin loadings, extending growth for this slice of the Bisphenol A market.
Automotive and transportation consumed nearly one-quarter of polycarbonate in 2025 and gained momentum from EV adoption. Each battery pack uses 5-8 kg of epoxy-based adhesive for structural integrity, a figure that scales with pack capacity. Polycarbonate headlight lenses save 40-50% weight relative to glass, aiding range gains. Broader glazing remains constrained by scratch and UV performance, but incremental coating advances are narrowing the gap. Construction, packaging, and medical devices round out demand. Packaging faces direct regulatory headwinds, yet industrial coatings for large vessels retain limited derogations until 2028, cushioning decline. Altogether, the end-user mix underscores how electronics and mobility anchor forward demand, reinforcing the growth narrative for the Bisphenol A market.
Geography Analysis
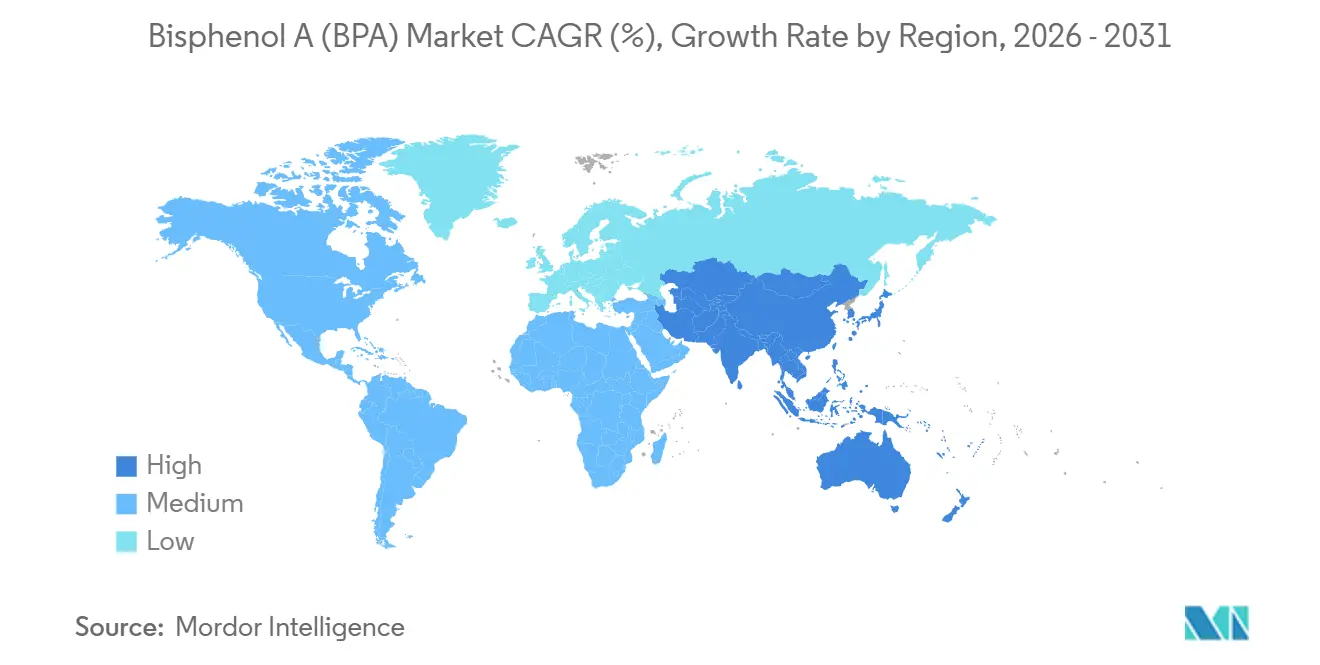
Asia-Pacific held 63.10% of the Bisphenol A market share in 2025 and is projected to grow at a 7.32% CAGR to 2031. China alone operated 5.931 million t/y of capacity by 2024 and lifted January–August 2025 output 12% year-on-year to 3.15 million tons. Recent startups at Wanhua, Qingdao Haiwan, and Hengli added 696,000 t/y, underpinning regional cost leadership. India’s USD 37 billion petrochemical build-out through 2030 seeks to reduce heavy dependence on imports, 5.018 million-ton inflows of organic chemicals in FY 2023-24 signal latent demand the subcontinent will eventually meet locally.
North America and Europe together account for a declining slice of the Bisphenol A market as higher feedstock costs and anti-dumping duties distort trade. North American phenol hovered near USD 902/t in Q4-2025, squeezing integrated margins when Asian imports landed below domestic cash costs. EU duties of 17.3-33% shield local epoxy suppliers yet raise downstream compounder costs and encourage production shifts toward Asia. Western suppliers respond by doubling down on circular feedstocks and specialty grades, hoping to preserve value despite volume leakage.
South America and the Middle East & Africa remain small but strategic. SABIC’s diversification agenda, despite a 63.8% profit drop in Q3-2024, keeps polycarbonate on the investment map. Brazilian vehicle output ranks sixth worldwide, offering opportunities for lightweight glazing once currency stability returns. South African construction specifications now include flame-retardant polycarbonate panels, opening a modest but growing outlet. These emerging nodes will not rival Asia-Pacific in scale but add resilience to global Bisphenol A market demand.

Regulatory Landscape
Regulatory pressure is most acute in European food-contact uses. Commission Regulation (EU) 2024/3190 prohibits the use and trade of BPA and certain other bisphenols in materials and articles intended for food contact, with the framework applying from 20 January 2025 and transition provisions that allow specific non-compliant articles to be first placed on the market until 20 July 2026. Certain professional repeat-use food production equipment has longer transitional timing referenced in the regulation framework. As a result, EU demand shifts away from BPA in food-contact polycarbonate and coatings toward industrial applications, including epoxy systems for wind-energy and other durable goods.
In the United States, BPA remains under active information-gathering and chemical-management oversight rather than a blanket ban. Under TSCA Section 8(d), EPA requires manufacturers and importers to submit unpublished health and safety studies for BPA, and the agency extended the reporting deadline in May 2026 to May 21, 2027. EFSA activity and EU consultation work on bisphenols beyond BPA also point to broader scrutiny, increasing compliance workload for producers and downstream converters that use or evaluate substitute bisphenols.
Value Chain Analysis
BPA sits midstream in an aromatics-derived chain that begins with benzene and propylene to cumene, followed by cumene oxidation to phenol and acetone, which are the immediate feedstocks for BPA. Production typically uses acid-catalyzed condensation of phenol and acetone (commonly via cation-exchange resin catalyst systems), followed by purification steps to achieve grades suitable for polycarbonate and epoxy applications. Technology upgrades such as continuous processing and improved purification are used to manage impurity profiles and cost. Upstream phenol and acetone price volatility tends to feed through quickly into BPA pricing and operating rates, particularly for non-integrated assets.
Downstream, polycarbonate and epoxy resins dominate consumption. BPA moves either via captive integration, from BPA into polycarbonate and epoxy within the same producer group, or via merchant sales to resin producers and compounders serving electronics, automotive, construction, and industrial composites. Europe’s restriction on BPA in food-contact materials under Commission Regulation (EU) 2024/3190 is pushing converters and brand owners to re-qualify formulations and adjust sourcing. At the same time, Asia-Pacific integration around phenol-acetone hubs continues to pull the chain toward regional self-sufficiency, shortening merchant trade lanes.
Competitive Landscape
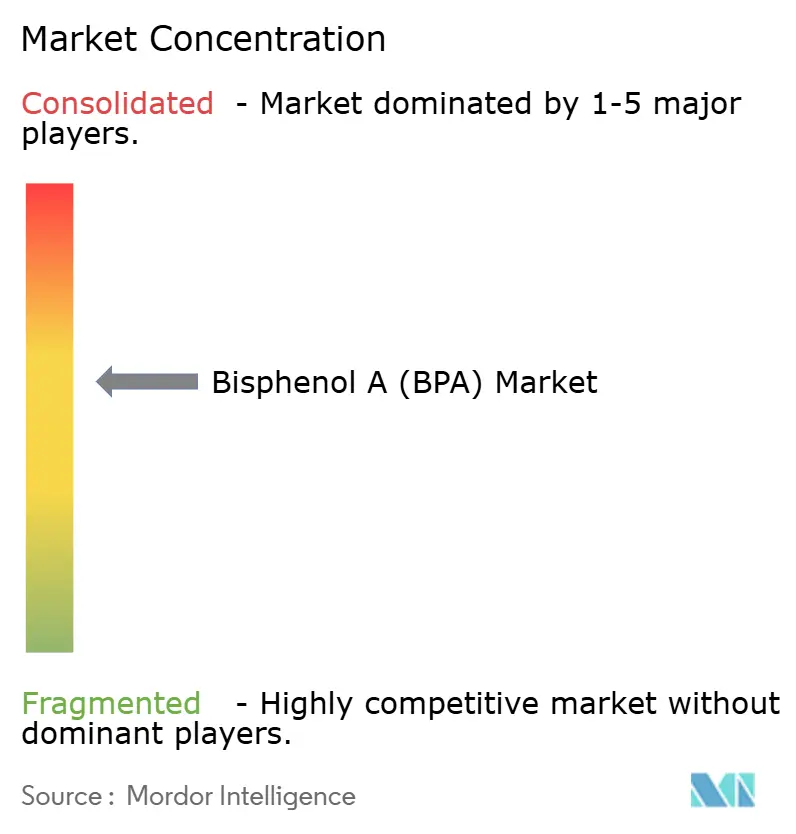
The Bisphenol A (BPA) market is moderately consolidated. Integrated Chinese firms capture commodity share by adding captive phenol-acetone and continuous-flow technology, which delivers a 5-8% margin lift over batch rivals. White-space innovation focuses on closed-loop recycling and aerospace-grade derivatives. Texas A&M’s 200 kt/y methanolysis pilot could supply 2% of 2031 needs if scale-up holds economics. Mitsui Chemicals and Teijin plan fermentation-derived BPA but still face cost-parity hurdles. Competitive strategy is thus polarizing: low-cost Asian producers chase scale, while Western incumbents pursue circular feedstocks, differentiated grades, and regulatory know-how.
Bisphenol A (BPA) Industry Leaders
Covestro AG
SABIC
LG Chem
Chang Chun Group
KUMHO P&B CHEMICALS.,INC.
- *Disclaimer: Major Players sorted in no particular order

Market Opportunities and Future Outlook
A near-term whitespace is emerging in industrial end uses that are less exposed to food-contact restrictions, particularly epoxy systems tied to large composite structures. Wind-turbine blades consume several hundred kilograms of BPA-derived epoxy per blade, and Europe’s offshore installations consumed about 24,000 tons of such epoxy in 2025, supporting demand for epoxy-grade and high-purity BPA aligned with durability and fatigue-life requirements. Aerospace and advanced electronics also sustain qualification-driven demand for high-purity derivatives, with ultra-pure BPA supporting high glass-transition epoxy systems and hydrogenated BPA used in moisture-resistant semiconductor encapsulation.
On the supply side, process and circularity pathways create additional commercial room for producers and technology providers. Continuous-flow phenol-acetone integration and purification upgrades, including melt-crystallization approaches referenced in industry technology discussions, support tighter product specs and operating-cost improvements, helping suppliers defend margins amid widening regional feedstock gaps. Closed-loop depolymerization and methanolysis pilots in Texas and Europe, along with the market shift triggered by the EU’s BPA food-contact restrictions and EFSA’s ongoing work on bisphenols, are also increasing demand for traceability, compliance support, and application development as customers redesign formulations and re-qualify materials across packaging-adjacent and durable-goods segments.
Recent Industry Developments
- May 2026: The US Environmental Protection Agency extended the reporting deadline for its TSCA Section 8(d) health and safety data reporting rule covering Bisphenol A and other substances to May 21, 2027. The extension preserves an active compliance cycle for BPA producers and importers, keeping regulatory attention on hazard data completeness and potentially influencing customer qualification and documentation requirements.
- April 2026: LG Chem began due diligence related to its Daesan BPA operations, reported in the context of exploring strategic collaboration and/or stake sale options for its BPA business. This move highlights portfolio rebalancing among large producers and can affect regional merchant availability, integration strategy with epoxy and polycarbonate chains, and investment priorities for commodity BPA assets.
- December 2024: The European Commission adopted a ban on the use of Bisphenol A (BPA) in food-contact materials, covering applications such as can coatings and certain reusable plastic articles. The decision accelerated reformulation and re-qualification activity among food-contact converters while redirecting BPA demand emphasis toward industrial and engineering applications less constrained by food-contact rules.


Research Methodology Framework and Report Scope
Market Definition and Coverage
For this methodology, the market covers bisphenol A (BPA) produced and consumed globally, tracked as total demand volume used as an intermediate chemical for downstream resin and compound manufacturing across major end-use industries.
Scope exclusions: Excludes finished products made from BPA-derived resins (for example packaged goods or coated end items), and counts only BPA volume itself.
Segmentation Overview
- By Application
- Polycarbonate Resins
- Epoxy Resins
- Unsaturated Polyester Resins
- Flame Retardants
- Other Applications
- By End-user Industry
- Electrical and Electronics
- Automotive and Transportation
- Construction and Infrastructure
- Packaging
- Others (Medical, Sports Equipment, etc.)
- By Geography
- Asia-Pacific
- China
- India
- Japan
- South Korea
- ASEAN
- Rest of Asia-Pacific
- North America
- United States
- Canada
- Mexico
- Europe
- Germany
- United Kingdom
- France
- Italy
- Spain
- Russia
- Rest of Europe
- South America
- Brazil
- Argentina
- Rest of South America
- Middle-East and Africa
- Saudi Arabia
- South Africa
- Rest of Middle-East and Africa
- Asia-Pacific
Data Validation & Update Cycle
Results are checked through a triangulation workflow, where regional totals are compared against independent signals such as trade balances, known capacity envelopes, and downstream resin production direction. Any sharp year-to-year changes trigger anomaly review, and the assumptions are rechecked with follow-up discussions when the movement cannot be explained by clear events.
Before sign-off, the model is reviewed in multiple steps, including internal peer checks on country math, conversion factors, and assumption consistency across regions. Reports are refreshed annually, and interim updates are made when major events occur, such as large plant outages, regulatory actions, or meaningful capacity announcements. Right before delivery, a final pass is done so clients receive the most current view available.
Mordor Intelligence's Bisphenol A Bpa Market Estimate Compared With Other Published Estimates
Published BPA market values can differ widely because some studies report value while others report volume, and because base years and conversion assumptions are not consistent across sources. Differences also show up when one estimate tracks BPA as a chemical intermediate and another blends in downstream resin value, which changes the meaning of the number.
The table points to a major gap driver in this market, which is unit choice and scope mapping across the value chain. In Mordor Intelligence's model, BPA is sized strictly in volume (million tons) at the chemical level and is then reconciled against apparent consumption using capacity and net trade checks, rather than pricing the downstream polycarbonate and epoxy markets into the same total.
Benchmark comparison
| Source | Market Size | Gaps in Research Methodology |
|---|---|---|
| Mordor Intelligence | USD 9.92 M (2026) | |
| Global Consultancy A | USD 20.12 B (2024) | Reports BPA as a revenue market value in USD, which can embed assumed average prices and may also mix in downstream resin economics, making it not directly comparable to a chemical volume total. |
| Industry Research Group B | USD 9.50 M (2025) | Uses volume (KMT) with a different base year and longer forecast window, and the conversion and rounding approach can shift the headline tonnage when reported at global level. |
Looking across the figures, the spread is mainly explained by whether the market is counted as chemical volume or as revenue value, followed by base year choice and conversion choices when tonnage is aggregated. By keeping the scope and unit consistent and then cross-checking against capacity, operating rates, and trade signals, the final estimate stays traceable to repeatable steps that a buyer can audit.


Key Questions Answered in the Report
What is the current global Bisphenol A market size?
It stands at 9.92 million tons in 2026 and is on track to reach 13.49 million tons by 2031.
Which application dominates BPA consumption?
Polycarbonate leads with 61.62% of the 2025 Bisphenol A market size.
Which region shows the fastest BPA demand growth?
Asia-Pacific is advancing at a 7.32% CAGR through 2031 and already holds 63.10% of global share.
How are regulations affecting BPA in food contact?
EU Regulation 2024/3190 bans BPA in food-contact items starting July 2026, shifting demand toward industrial uses.
What technological shifts could reshape future BPA supply?
Continuous-flow phenol-acetone integration and circular methanolysis recycling pilots promise lower costs and secondary feedstocks.
Page last updated on:




