
Asia-Pacific Peas Market Analysis by Mordor Intelligence
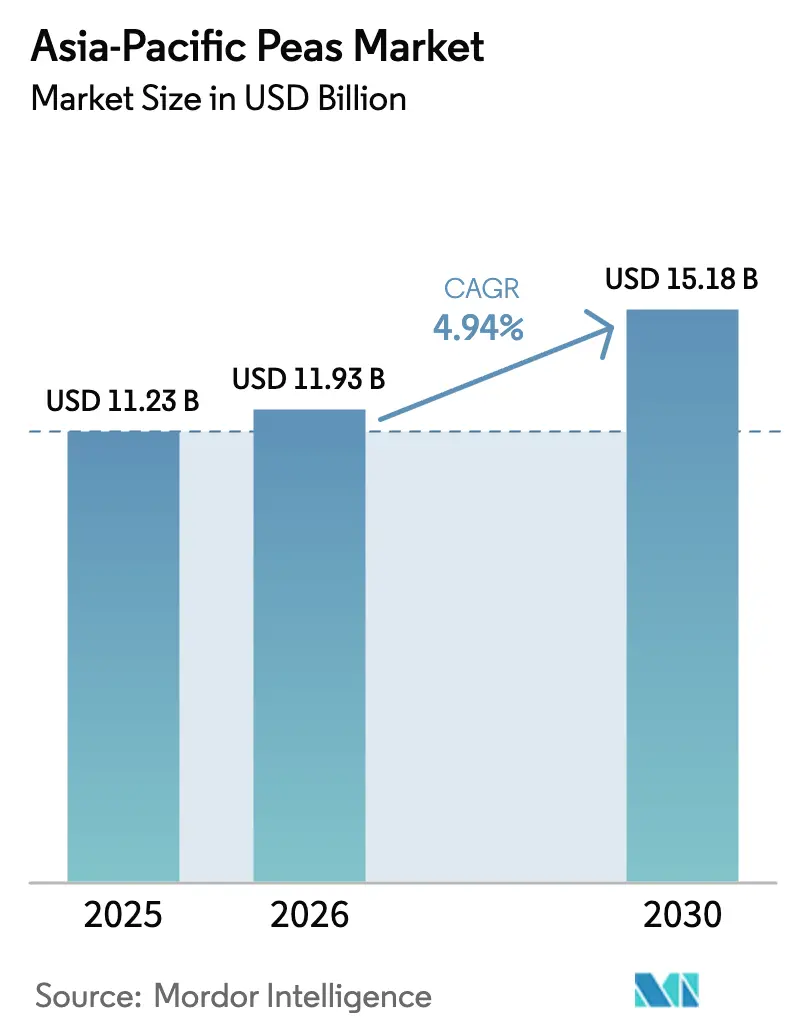
The Asia-Pacific Peas Market is projected to grow from USD 11.23 billion in 2025 to USD 11.93 billion in 2026 and is forecast to reach USD 15.18 billion by 2031 at a 4.94% CAGR over 2026-2031, underscoring a decisive pivot in regional protein sourcing. Government-backed pulse procurement programs, surging incorporation of pea ingredients in functional foods, and preferential agricultural credit for nitrogen-fixing crops are re-shaping supply chains and reinforcing demand diversity. Intensifying consumer focus on clean-label, non-genetically modified options elevates pea protein over soy and whey, while e-commerce platforms compress adoption cycles by expanding product access across tier-2 and tier-3 cities. Ingredient suppliers are refining enzymatic debittering and controlled fermentation to mitigate beany off-flavors, a step that raises production costs but unlocks premium applications in infant and clinical nutrition. Competitive momentum continues to accelerate as agri-fintech lenders channel working capital to smallholders, enabling timely seed purchases and stabilizing yields.
Key Report Takeaways
- By geography, China commanded 46.20% of Asia-Pacific Peas market share in 2025, while India is forecast to post the fastest 8.90% CAGR from 2026 to 2031.
Note: Market size and forecast figures in this report are generated using Mordor Intelligence’s proprietary estimation framework, updated with the latest available data and insights as of January 2026.
Market Trends and Insights
Drivers Impact Analysis of Asia-Pacific Peas Market*
| Driver | (~) % Impact on CAGR Forecast | Geographic Relevance | Impact Timeline |
|---|---|---|---|
| Rising demand for plant-based protein ingredients | +1.2% | China, India, Japan, and Australia | Medium term (2–4 years) |
| Government nutrition programs promoting pulse intake | +0.9% | India and China | Long term (≥ 4 years) |
| Expansion of functional foods fortified with pea protein | +0.8% | China, Japan, and urban India | Medium term (2–4 years) |
| Strong food-service uptake for pea-based meat analogs | +0.7% | India and China (tier-2 cities) | Short term (≤ 2 years) |
| E-commerce grocery penetration widening consumer access | +0.6% | China, India, and urban Australia | Short term (≤ 2 years) |
| Agri-fintech credit boosting pea acreage | +0.5% | India and rural China | Medium term (2–4 years) |
| Source: Mordor Intelligence | |||
Rising Demand for Plant-Based Protein Ingredients
Pea protein isolates and concentrates continue displacing soy and whey across sports nutrition, bakery fortification, and dairy alternatives, largely because consumers regard peas as non-genetically-modified and allergen-friendly. Regional pea protein ingredient revenues climbed to USD 800 million in 2023 and will likely top USD 1.5 billion by 2028, implying a 12% compound expansion[1]Source: Food Ingredients First, “Asia-Pacific Pea Protein Market Analysis,” FOODINGREDIENTSFIRST.COM. China and India generate more than 60% of this demand, driving the installation of spray-drying and air-classification lines that raise protein purity to 80% plus. Still, beany notes and lower gel strength dampen premium beverage uptake, spurring suppliers to invest in enzymatic debittering and fermentation-based flavor masking that add up to 20% to production cost yet enable entry into infant and clinical nutrition niches. Manufacturers also cite supply-chain diversification away from North American soy as a decisive benefit.
Government Nutrition Programs Promoting Pulse Intake
India’s Minimum Support Price (MSP) scheme for pulses sets floor prices that stabilize farm revenue and catalyze acreage gains, while the Pradhan Mantri Annadata Aay SanraksHan Abhiyan absorbs surplus output into strategic reserves [2]Source: Ministry of Agriculture and Farmers Welfare, “Pulse Production and Export Data 2024-25,” AGRICOOP.NIC.IN. China’s 14th Five-Year Plan for Food Security embeds pulse cultivation subsidies and processing grants to dilute dependence on imported soybeans. Japan’s 2024 Dietary Guidelines recommend higher legume intake, channeling peas into school-lunch menus [3]Source: Ministry of Health, Labour and Welfare, “Dietary Guidelines for Japanese 2024,” MHLW.GO.JP. These frameworks generate durable demand tailwinds, even though payment delays and fragmented subsidy disbursement can occasionally temper farmer enthusiasm.
Expansion of Functional Foods Fortified with Pea Protein
Snack bars, instant noodles, and breakfast cereals fortified with pea protein have gained popularity in urban areas of China and Japan, focusing on clean labels and providing incremental protein boosts of 8-12 grams per serving. In Japan, pea-protein instant ramen launched in 2024, targeting office workers, and was priced higher than conventional noodles. In China, bakeries now offer pea-protein steamed buns that retain a light crumb color while enhancing nutritional value, supported by neutral flavoring. In India, biscuit and extruded snack manufacturers incorporate pea concentrates as part of state-supported nutrition initiatives. Market entry challenges include navigating China’s 24-month novel-ingredient review process for infant foods and adhering to Japan’s allergen labeling requirements, which increase compliance costs but enhance consumer confidence.
Strong Food-Service Uptake for Pea-Based Meat Analogs
Quick-service chains in Bangalore, Hyderabad, and Pune introduced pea-protein burgers and wraps in 2024, pricing them below chicken patties to capture flexitarian diners. Parallel expansions in Chengdu and Hangzhou feature dumplings and noodle toppings born from collaborations between local operators and domestic pea suppliers that sidestep the cost of imported soy analogs. Australia’s café sector markets pea-protein sausages within affluent inner suburbs, while Japanese family restaurants remain cautious, citing consumer loyalty to tofu. Repeat purchase rates hover below 40%, so sustained growth depends on continuous advances in flavor and texture.
Restraints Impact Analysis of Asia-Pacific Peas Market*
| Restraint | (~) % Impact on CAGR Forecast | Geographic Relevance | Impact Timeline |
|---|---|---|---|
| Pest and disease outbreaks in major producing zones | -0.8% | India, China, and Australia | Short term (≤ 2 years) |
| Price volatility tied to global pulse trade flows | -0.7% | China, India, and Japan | Short term (≤ 2 years) |
| Soil nutrient depletion from intensive pea rotations | -0.4% | India and China | Long term (≥ 4 years) |
| Allergen concerns over legume lectins in infant foods | -0.3% | China and Japan | Medium term (2–4 years) |
| Source: Mordor Intelligence | |||
Pest and Disease Outbreaks in Major Producing Zones
Pea weevil and Fusarium wilt clipped yields by up to 18% across Madhya Pradesh and Uttar Pradesh in the 2024-25 rabi season, requiring expanded extension services to promote integrated pest management. Australian growers boosted fungicide budgets by AUD 60 (USD 40) per hectare to curb powdery mildew and root rot, eroding farm profitability. China issued national IPM (Integrated Pest Management) guidelines, but adoption lags amid limited access to biological controls. Climate variability intensifies pest pressure, elevating the urgency for resistant cultivars.
Price Volatility Tied to Global Pulse Trade Flows
Drought conditions in Canada caused a significant increase in Free On Board (FOB) Vancouver pea prices, rising from USD 320 per metric ton in January 2024 to USD 410 per metric ton by September 2024. This price surge was driven by reduced supply due to adverse weather conditions, impacting global trade dynamics. Payment bottlenecks in Russian export corridors further drove up spot prices for Chinese importers, creating additional challenges for buyers in securing a consistent supply. Meanwhile, India periodically implemented pulse export duties to manage domestic inflation, disrupting procurement strategies for processors bound by fixed-price contracts and forcing them to reassess their sourcing options. The lack of mature regional futures markets limits hedging opportunities, increasing vulnerability to spot price volatility and leaving market participants exposed to sudden price swings.
*Our forecasts treat driver/restraint impacts as directional, not additive. The impact forecasts reflect baseline growth, mix effects, and variable interactions.
Geography Analysis
China Peas Market
China held 46.20% of the Asia-Pacific pea market share in 2025, reflecting its position as the world's largest pea importer and a major processor of pea starch, protein isolates, and vermicelli. Domestic pea cultivation is concentrated in Heilongjiang and Inner Mongolia, where cold-tolerant varieties yield 1.8 to 2.2 metric tons per hectare, but total production remains insufficient to meet processing demand. China's 14th Five-Year Plan for Food Security prioritized protein diversification to reduce reliance on imported soybeans, with provincial governments offering subsidies for pulse cultivation and processing infrastructure. This policy framework supports long-term demand for peas, though trade policy uncertainty and geopolitical tensions with major suppliers introduce supply chain risks.
India Peas Market
India's 8.90% CAGR from 2026 to 2031 reflects the country's expanding role as both a producer and exporter of peas, supported by government procurement programs, agri-fintech credit, and rising domestic consumption of plant-based proteins. Major export destinations included Bangladesh, China, the United Arab Emirates, and the United States, underscoring India's competitiveness in global pulse markets. The Minimum Support Price mechanism for pulses, administered by the Ministry of Agriculture and Farmers Welfare, guaranteed floor prices for peas in the 2024-25 crop year, stabilizing farmer income and encouraging acreage expansion. Addressing these agronomic challenges through integrated pest management and resistant varieties will be critical to sustaining India's growth trajectory.
Australia and Japan Peas Market
Australia and Japan occupy smaller but strategically important positions in the regional market. Australian growers in Western Australia and South Australia cultivate field peas primarily for export, with domestic consumption limited to livestock feed and small-scale human consumption. Japan remains a net importer, channeling peas into snack foods, instant noodles, and plant-based dairy alternatives, though domestic acreage is minimal due to land constraints and higher returns from rice and vegetable cultivation. Japanese food manufacturers prioritize pea protein for its allergen-friendly profile relative to soy, driving demand for imported isolates and concentrates from China and North America. Japan's Dietary Guidelines for Japanese, updated in 2024, recommend increased legume intake to address rising rates of lifestyle-related diseases, indirectly supporting pea consumption through school-lunch programs and public-health campaigns.
Regulatory Landscape
Across Asia-Pacific, peas and pea-ingredient trade is shaped by tariff levers, import licensing, and phytosanitary import health standards, with India and China setting the tone for regional flows. In India, the Directorate General of Foreign Trade (DGFT) re-imposed a 30% total ad valorem import duty on yellow peas in October 2025 and subsequently extended the policy through March 31, 2027, keeping the 30% duty structure in place. This stance contrasts with the continued duty-free import treatment extended for selected pulses (for example, pigeon pea and urad) through March 31, 2027, highlighting how crop-specific policy is used to balance domestic price stability with supply availability.
Market access and compliance also depend on SPS requirements and food-safety rules for processed pea ingredients. Australia and New Zealand operate detailed import health standards and phytosanitary protocols for peas, including prescribed certification and treatment requirements, while Japan applies strict food labeling and consumer protection practices that shape ingredient positioning in packaged foods. In China and Japan, higher-compliance end uses, especially infant and clinical nutrition applications, face longer review and approval pathways, which increases time-to-market and pushes suppliers toward stronger traceability and quality assurance programs.
Value Chain Analysis
The regional value chain begins with seed procurement and agronomy services, including pest management and extension support, then moves through farm production and aggregation. It then splits into (i) whole and split pea channels for retail and foodservice and (ii) processing routes for starch, protein concentrates or isolates, and specialty fractions. India links farm output to government-backed procurement and reserve building alongside private trading, which supports raw material availability for split-pea and ingredient processors; Australia supplies export-oriented field peas from broadacre systems integrated into cereal rotations for nitrogen benefits; and China sits at the center of downstream processing demand, pulling volumes into cleaning, grading, milling, and fractionation before distribution to food manufacturers.
Trade logistics and policy shocks are central to margin and continuity, particularly for China, the main import-driven processing hub. In 2025, China imported about 1.91 MMT of dried peas (up from 1.39 MMT in 2024), with sourcing concentrated in Russia (about 60% share) and Canada (about 28%), and Shandong acting as a key import destination province. This import concentration increases exposure to corridor disruptions and tariff moves, pushing processors to diversify origins, tighten inbound quality specs, and rely on longer-term contracting with exporters and cooperatives. At the same time, low production in Australia in 2024/25 (roughly 221,000 to 230,000 tonnes) points to how acreage shifts and agronomic constraints can tighten exportable surplus and amplify procurement volatility.
Competitive Landscape
The Asia-Pacific Peas market is characterized by multinational ingredient houses, regional processors, and farmer-owned cooperatives competing for long-term supply contracts. Chinese processors have scaled enzymatic debittering and air-classification lines to raise protein purity above 80%, then locked in multiyear agreements with beverage and pet-food manufacturers that demand tight functional specifications. Indian exporters focus on low-cost concentrates and split peas for confectionery and bakery applications, benefiting from Minimum Support Price procurement that keeps raw-material costs predictable. Australian cooperatives position traceable, non-genetically-modified crops at a 10% premium under five-year supply deals with Chinese isolate producers, while Japanese firms allocate research budgets to pea-protein ramen and dairy analogs that comply with strict allergen labeling rules.
Innovation pressure is high as suppliers race to erase beany off-flavors and elevate gel strength to parity with soy. Patent filings covering flavor masking, high-shear texturization, and solvent-free extraction increased between 2023 and 2024, underscoring intensifying intellectual property competition. Larger processors invest in precision agriculture, blockchain traceability, and inline near-infrared analyzers, whereas many smallholders still rely on manual cultivation and visual quality checks. Direct-to-consumer brands leverage e-commerce to bypass retail gatekeepers, offering pea-protein shakes and baking mixes that reach tier-2 and tier-3 cities through subscription bundles and influencer marketing.
White-space opportunities include infant formulas, clinical nutrition blends, and fermented dairy alternatives once regulatory pathways become clearer in China and Japan. Yet weak enforcement in some jurisdictions diminishes the defensive value of patents, encouraging rapid technology imitation and forcing innovators to differentiate on cost and service rather than exclusivity. Rising capital expenditure on spray-drying capacity in Shandong and Gujarat signals confidence in long-run demand, but sustained profitability will hinge on continued flavor improvements, robust farmer engagement programs that stabilize raw-material supply, and proactive navigation of import-policy risks across Canada and Russia.
Market Opportunities and Future Outlook
A key whitespace is the build-out of Asia-Pacific-adjacent processing capacity for pea protein and related fractions to serve functional foods, meat analogs, and premium nutrition segments with shorter lead times and stronger traceability. A visible proof point is the Agro Snow joint venture by Agrocorp International and Megmilk Snow Brand, which initiated construction in November 2024 in Tanjung Langsat, Johor Bahru (Malaysia) for pulse protein extraction. The facility was designed for 6,000 metric tonnes of isolates annually. Such investments support regional formulation demand that increasingly requires consistent flavor, microbiological control, and functionality, and they fit alongside technology upgrades already underway in key processing clusters.
On the supply side, government programs and digital agronomy tools are widening the addressable base of pulse growers and improving production practices, creating opportunities for seed companies, crop protection providers, aggregators, and processors that can contract directly with farmers. India’s Mission for Aatmanirbharta in Pulses (2025-26 to 2030-31), with an outlay of Rs 11,440 crore and support mechanisms including procurement via NAFED and NCCF for participating farmers and post-harvest subsidies (up to Rs 25 lakh per unit for processing units), offers a structured pathway to expand organized sourcing and local processing. In parallel, advisory and farmer-education tools are scaling, such as ICAR-National Institute of Biotic Stress Management’s June 2026 release of the Lathyrus Info mobile application, which signals broader adoption of ICT-enabled cultivation guidance that can improve quality consistency across downstream pea ingredient value chains.
Recent Industry Developments in Asia-Pacific Peas Market
- July 2026: Agroenergy Group announced a USD 24.2 million investment to build a yellow pea deep processing plant in the Kyiv region, designed for 35,000 tons of annual yellow pea processing. The investment adds incremental fractionation capacity for pea-derived ingredients and can affect import availability and pricing for Asia-Pacific processors that diversify sourcing beyond Canada and Russia.
- March 2025: China approved the import of peas from Ukraine by accepting the phytosanitary protocol, with Ukraine completing its domestic approval steps to operationalize shipments. This market-access change broadens the pool of eligible suppliers into China and strengthens origin optionality for Chinese processors that manage tariff and corridor risks through multi-origin procurement.
- September 2024: A Japanese food manufacturer launched pea-protein-enriched instant ramen in convenience stores across Tokyo, Osaka, and Nagoya, targeting higher-protein lunches without animal-derived additives. The productized use case helps normalize pea protein in mainstream packaged foods and supports pull-through demand for consistent, label-compliant pea ingredients in Japan.


Asia-Pacific Peas Market Report Scope and Research Methodology
Market Definition and Coverage
For this report, the market covers peas consumed and traded across Asia-Pacific, measured in value terms, and linked back to regional production, consumption, and trade flows across major pea-growing and importing countries.
Scope exclusions: We exclude downstream packaged food margins and retail markups, and we also exclude non-pea pulse crops and pea-derived ingredients where they are not traded as peas.
Segments Covered in This Report
- Geography
- China
- Production Analysis (Area Harvested, Yield, and Production Volume)
- Consumption Analysis (Consumption Value and Volume)
- Import Market Analysis (Import Value, Volume, and Key Supplying Markets)
- Export Market Analysis (Export Value, Volume, and Key Destination Markets)
- Wholesale Price Trend Analysis and Forecast
- Regulatory Framework
- List of Key Players
- Logistics and Infrastructure
- Seasonality Analysis
- Australia
- Production Analysis (Area Harvested, Yield, and Production Volume)
- Consumption Analysis (Consumption Value and Volume)
- Import Market Analysis (Import Value, Volume, and Key Supplying Markets)
- Export Market Analysis (Export Value, Volume, and Key Destination Markets)
- Wholesale Price Trend Analysis and Forecast
- Regulatory Framework
- List of Key Players
- Logistics and Infrastructure
- Seasonality Analysis
- India
- Production Analysis (Area Harvested, Yield, and Production Volume)
- Consumption Analysis (Consumption Value and Volume)
- Import Market Analysis (Import Value, Volume, and Key Supplying Markets)
- Export Market Analysis (Export Value, Volume, and Key Destination Markets)
- Wholesale Price Trend Analysis and Forecast
- Regulatory Framework
- List of Key Players
- Logistics and Infrastructure
- Seasonality Analysis
- Japan
- Production Analysis (Area Harvested, Yield, and Production Volume)
- Consumption Analysis (Consumption Value and Volume)
- Import Market Analysis (Import Value, Volume, and Key Supplying Markets)
- Export Market Analysis (Export Value, Volume, and Key Destination Markets)
- Wholesale Price Trend Analysis and Forecast
- Regulatory Framework
- List of Key Players
- Logistics and Infrastructure
- Seasonality Analysis
- China
Data Validation & Update Cycle
Validation is done through cross-checks across independent signals, then reviewed again at the country level before regional totals are finalized. We compare modeled consumption value with production and net trade direction, then inspect outliers such as sudden price spikes, unusual import surges, or yield shocks and re-contact primary sources when the variance looks structural.
Before publication, the model and assumptions go through a multi-step analyst review so unit consistency, currency timing, and year alignment errors are removed. Reports are refreshed annually, with interim updates added when a material event occurs, such as a major tariff change or an abnormal harvest outcome. Right before delivery, an analyst runs a final update pass so the latest public releases are reflected.
How Mordor Intelligence's Asia-Pacific Peas Market Size Compares to Other Published Estimates
Published numbers for Asia-Pacific peas can differ a lot, even when they appear to cover the same geography. The gaps usually come from how each publisher treats the value point in the chain, the product boundary (fresh versus dry), and the year used for pricing and currency conversion.
Trade volumes and wholesale price checks across the main importing routes are used as the evidence that keeps Mordor Intelligence's estimate tied to pea consumption value in-region, rather than drifting toward retail-priced foods or narrow niche categories. Differences also show up when some estimates count only a limited subset of peas (for example organic or a restricted country list), or when older price bases are carried forward without re-testing against the latest trade and harvest signals.
Benchmark comparison
| Source | Market Size | Gaps in Research Methodology |
|---|---|---|
| Mordor Intelligence | USD 11.23 B (2025) | |
| Industry Data Provider A | USD 0.29 B (2024) | Uses a much narrower value scope that appears closer to a limited segment view of peas in APAC, and it can understate totals when fresh and dry peas, informal channels, and broader country coverage are not fully captured. |
| Trade Analytics Publisher B | USD 4.00 B (2024) | Value is framed around producer and importer revenues for dry peas, which can exclude parts of the broader peas market and can shift totals depending on whether wholesale pricing, consumer-facing pricing, and non-dry forms are included. |
The table mainly shows that scope boundaries drive the spread, especially around fresh versus dry coverage and where pricing is taken in the chain. By keeping the model traceable to production, net trade, and wholesale pricing, the estimate stays repeatable and easier to reconcile with real-world supply and demand signals year over year.


Key Questions Answered in the Report
How large is the Asia-Pacific Peas market in 2026?
The Asia-Pacific Peas market size will surpass USD 11.93 billion in 2026, maintaining the 4.94% CAGR.
Which country dominates regional pea consumption?
China remains the largest consumer, accounting for 46.20% of Asia-Pacific Peas market share in 2025 through extensive import and processing operations.
Which geography is growing the fastest through 2031?
India leads growth with an 8.90% CAGR from 2026 to 2031, driven by export-oriented processing and government pulse procurement support.
What is the main driver of pea protein demand?
Rising consumer preference for plant-based, non-genetically-modified proteins in functional foods and beverages is the most powerful growth driver across Asia-Pacific.
What challenges could restrain future expansion?
Key restraints include pest and disease outbreaks, price volatility linked to global trade flows, soil nutrient depletion from monoculture, and lectin allergen concerns in infant formulas.
Which new product areas offer white-space opportunity?
Infant formulas, clinical nutrition blends, and fermented dairy alternatives fortified with high-purity pea protein present attractive growth avenues once regulatory hurdles ease.
Page last updated on:






