
Asia-Pacific Guar Market Analysis by Mordor Intelligence
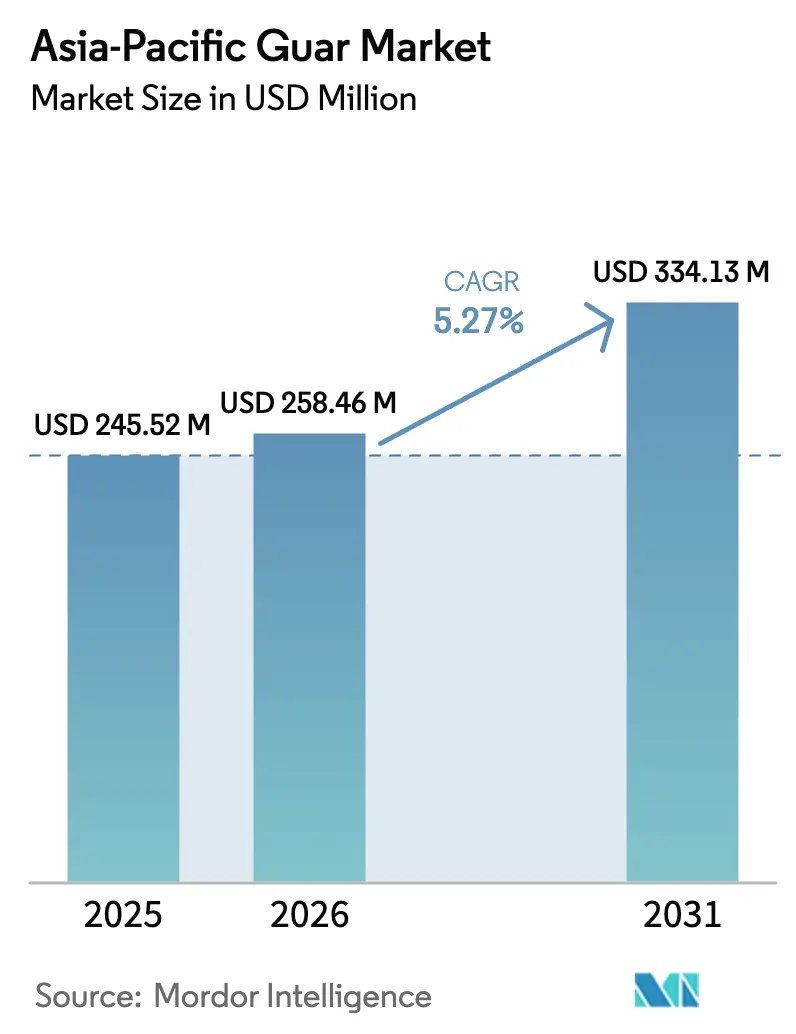
The Asia Pacific guar market size is projected to grow from USD 245.52 million in 2025 to USD 258.46 million in 2026 and is forecast to reach USD 334.13 million by 2031 at a 5.27% CAGR over 2026-2031. The expansion reflects shifting end-use priorities, particularly the pivot from hydraulic fracturing toward premium food, beverage, and biodegradable packaging applications. India supplies nearly 80% of global guar and anchors regional availability, but its concentration in Rajasthan introduces acute weather-related procurement risk. China’s rising shale activity adds volume demand yet increasingly substitutes polyacrylamide in high-temperature wells, tempering guar growth in the oil and gas segment. Urban consumers across China, India, and Japan favor clean-label foods and beverages, driving formulators to select guar over costlier xanthan or cellulose, while Japanese regulations on single-use plastics have opened a pathway for biodegradable guar-based films.
Key Report Takeaways
- By geography, India led with 71.20% of the Asia Pacific guar market share in 2025, while Australia is projected to advance at a 7.60% CAGR through 2031.
Note: Market size and forecast figures in this report are generated using Mordor Intelligence’s proprietary estimation framework, updated with the latest available data and insights as of January 2026.
Market Trends and Insights
Drivers Impact Analysis of Asia-Pacific Guar Market*
| Driver | (~) % Impact on CAGR Forecast | Geographic Relevance | Impact Timeline |
|---|---|---|---|
| Rising export-oriented demand for processed foods | +0.8% | India, China, and Japan | Medium term (2-4 years) |
| Growing use of guar gum as a clean-label thickener in premium dairy and plant-based beverages | +0.9% | China, India, Australia, and Japan | Short term (≤ 2 years) |
| Uptick in shale stimulation projects in China’s Sichuan and Tarim basins | +0.6% | China with spillover to India exports | Medium term (2-4 years) |
| Emergence of biodegradable guar-based films replacing single-use plastics in Japan | +0.4% | Japan, early adoption in urban China | Long term (≥ 4 years) |
| Rapid expansion of e-commerce cosmetics that favor natural rheology modifiers | +0.5% | China, India, and Japan | Short term (≤ 2 years) |
| Government incentives for drought-resilient crops in Australia’s dryland farming belts | +0.3% | Australia | Long term (≥ 4 years) |
| Source: Mordor Intelligence | |||
Rising Export-Oriented Demand for Processed Foods
Exports of processed foods from India reached USD 7.8 billion in 2025, with government programs targeting USD 100 billion by 2030, which sustains demand for hydrocolloid stabilizers in export-grade products [1]Source: Volza, “India Guar Gum Export Data,” volza.com. China shipped significant amount of processed foods in 2023, during which seafood processors deployed guar to improve freeze-thaw stability. Japan exported JPY 1.45 trillion (approximately USD 9.7 billion) of food products in 2024, targeting premium positioning that aligns with clean-label ingredient trends and natural thickener preferences [2]Source: Ministry of Agriculture, Forestry and Fisheries, “2024 Food Export Statistics,” maff.go.jp. Regional food-thickener demand is growing, outpacing global averages, as processors seek lower-cost alternatives to xanthan. India’s guar gum shipments have grown since 2021 while rising faster in value, indicating premiumization and derivative innovation.
Growing Use of Guar Gum as a Clean-Label Thickener in Premium Dairy and Plant-Based Beverages
The global plant-based milk segment surpass in 2024, with Asia Pacific posting the fastest gain as urban consumers adopt dairy alternatives. Guar’s neutral taste and quick hydration enhance mouthfeel at 0.1-0.3% inclusion, making it preferable to cellulose in premium oat and almond beverages. A 2024 peer-reviewed study confirmed guar represents 90% of global galactomannan supply and delivers superior swelling ratios compared with synthetic thickeners. Syensqo launched blockchain-enabled traceability in 2025, adding supply-chain transparency that appeals to premium brands [3]Source: Syensqo, “The Sustainable Guar Initiative,” syensqo.com. Formulators blend guar with locust bean gum to achieve synergistic viscosity at lower total hydrocolloid loadings, saving 10-15% on ingredient costs.
Uptick in Shale Stimulation Projects in China’s Sichuan and Tarim Basins
China consumed 422.2 billion cubic meters of natural gas in 2024, up 7.8%, with shale output expanding in Sichuan and Tarim. Deep reservoirs above 150 °C prompt operators to substitute guar with polyacrylamide for higher thermal stability, compressing guar’s share even as well count rises. Indian exporters shipped guar gum to China in 2024, so any substitution would directly affect trade volumes. Environmental codes are tightening residue limits for fracturing fluids, favoring synthetic polymers that reduce formation damage. Guar demand linked to Chinese shale is growing more slowly due to limited shale development in the region.
Emergence of Biodegradable Guar-Based Films Replacing Single-Use Plastics in Japan
Japan’s Plastic Resource Circulation Act (PRCA) from 2022 drives the shift from single-use plastics toward biodegradable alternatives. Guar’s cost of USD 2-5 per kilogram is lower than cellulose substitutes, positioning it for mid-tier applications. Technical hurdles involve achieving tensile strength and moisture resistance without chemical modifications that undermine biodegradability. Ingredient suppliers and converters aim to commercialize films targeting urban markets where consumers are willing to pay premiums for sustainable packaging.
Restraints Impact Analysis of Asia-Pacific Guar Market*
| Restraint | (~) % Impact on CAGR Forecast | Geographic Relevance | Impact Timeline |
|---|---|---|---|
| Raw-material supply concentration in Rajasthan leading to procurement risk | -0.7% | Global with acute impact on China, Japan, and Australia importers | Short term (≤ 2 years) |
| High year-on-year price volatility tied to monsoon variability | -0.8% | Global | Short term (≤ 2 years) |
| Availability of cheaper cellulose and xanthan substitutes for thickening | -0.6% | China, Japan, and Australia | Medium term (2-4 years) |
| Stringent residue limits on hydro-fracturing additives in environmental codes | -0.4% | China with regulatory spillover to Australia | Medium term (2-4 years) |
| Source: Mordor Intelligence | |||
Raw-Material Supply Concentration in Rajasthan Leading to Procurement Risk
Rajasthan produces 70-72% of India’s guar, accounting for about 56% of global output, so a localized weather shock reverberates across global supply. A weak monsoon can reduce yields by up to 30%, sparking double-digit price moves within weeks. India exported USD 568.96 million and 453,612 metric tons of guar gum in 2024. and disruptions therefore ripple to leading buyers in the United States, Germany, and China. Alternative origins remain marginal, as Australia is experimental and Pakistan contributes modest volumes. Blockchain traceability under Syensqo’s initiative improves transparency but does not hedge physical supply risk.
High Year-on-Year Price Volatility Tied to Monsoon Variability
Guar is predominantly rain-fed, making yields highly sensitive to monsoon timing and distribution. Prices averaged INR 10,300-10,800 (USD 123-129) per 100 kgs in early 2025 but have historically spiked, as in 2012 when rates exceeded USD 12,000 per metric ton. In 2024, the instability index ranked guar as the most volatile Indian export commodity. During price spikes, buyers reformulate with xanthan, cellulose, or tara gum, eroding guar share where functional parity exists. Futures markets remain undeveloped, so most users stay exposed to spot volatility.
*Our forecasts treat driver/restraint impacts as directional, not additive. The impact forecasts reflect baseline growth, mix effects, and variable interactions.
Geography Analysis
India Guar Market
India’s dominance rests on Rajasthan’s arid climate and Kandosol soils that suit guar, along with decades of seed improvement and agronomic knowledge. Processing hubs near Jodhpur convert beans into splits and powder, supporting rapid shipment to global buyers. The Asia-Pacific guar market size linked to Indian deliveries will grow as exporters introduce certified sustainable grades to win premium contracts. Yet monsoon dependency exposes the supply chain to yield swings, which can send prices sharply higher, as seen in recent seasons with 10-15% volatility.
Australia Guar Market
Australia aims to build a secondary supply base. Trials in the Northern Territory show promising yields under supplemental irrigation and could enable local processors to capture value from milling and derivative production. Government water-infrastructure incentives make on-farm dams and low-pressure systems viable, potentially integrating guar into crop rotations that include sorghum and chickpeas. If processing plants come online, Australia could supply close-to-market volumes to East Asian clients, reinforcing regional resilience.
China and Japan Guar Market
China and Japan play outsized roles on the demand side. Chinese shale stimulation once used significant amounts of guar but now prefers polyacrylamide in high-temperature reservoirs. Nonetheless, China’s packaged food and e-commerce cosmetics industries continue to import guar for viscosity and texture. Japan’s Plastic Resource Circulation Act (PRCA) accelerates research into biodegradable guar films, and its premium processed food exports pull in clean-label stabilizers. Together, these demand nodes counterbalance the supply risk that stems from India’s geographic concentration.
Regulatory Landscape
Guar gum is regulated as a food additive under Codex Alimentarius (INS 412), with use conditions generally governed by Good Manufacturing Practices (GMP), which supports cross-border formulation and trade for food and beverage applications. In Asia-Pacific, national rules add additional compliance layers, including China’s mandatory National Food Safety Standard GB 28403-2012, which sets safety and quality criteria for guar gum (including limits for heavy metals and microbiological indicators). These requirements shape importer specifications and supplier testing protocols.
On the trade and exports side, India’s guar exporters operate within frameworks facilitated by APEDA and export-policy notifications administered by DGFT, while premium-market access typically depends on documented quality and safety compliance. For instance, Indian shipments to the European Union require adherence to the EU’s enhanced official controls regime for certain products, including specified official certification procedures referenced in Commission Implementing Regulation (EU) 2019/1793 and later amendments. This has pushed more exporters toward formalized documentation, traceability, and third-party testing to reduce border rejections and customer audits.
Value Chain Analysis
The regional value chain starts with largely rain-fed guar cultivation concentrated in India, notably Rajasthan. Smallholder farmers supply pods and seed into local aggregation channels, including Farmer Producer Organizations (FPOs) that support farm-gate procurement and basic quality sorting. Processing is clustered around Rajasthan, including the Jodhpur area, where processors convert beans into splits and then mill and refine guar gum powders for differentiated end uses, spanning commodity grades to higher-spec food and industrial grades, before moving into domestic distribution and export logistics supported by established export facilitation channels.
Quality assurance, traceability, and logistics concentration shape competitiveness. Concentrated refining capacity near Jodhpur improves scale and export readiness, but it also concentrates exposure to localized weather, infrastructure disruption, and compliance shocks. In August 2025, the South Asia Biotechnology Centre (SABC) launched a Sustainable Guar Initiative in Rajasthan with Jodhpur-based processors and local FPOs, including Agronaut FPO and Jikaka FPO. The initiative reflects a supply-side push toward improved agronomy and more consistent quality that aligns with buyer needs in premium foods, cosmetics, and other applications requiring traceable sourcing.
Competitive Landscape
The Asia-Pacific guar market shows moderate concentration. Hindustan Gum leads with a major share, leveraging integrated farming programs and in-house testing to ensure batch consistency. Jai Bharat Gum, Neelkanth Polymers, and Vikas WSP constitute the organized mid-tier, focusing on export logistics and derivative innovation such as fast-hydrating guar for energy drilling and high-protein meal for animal feed.
The unorganized segment, comprising small-scale, traditional, and informal business units operating outside systematic corporate oversight and industrial standardization, accounts for 90% of processors by number but lacks quality certification, limiting participation in pharmaceutical and premium food applications. Organized exporters invest in precision agriculture, including remote sensing to monitor crop health and schedule harvests, thereby stabilizing quality and reducing waste. Global ingredient majors are reshaping the landscape. Tate and Lyle completed the USD 1.8 billion CP Kelco acquisition in 2024, adding pectin and specialty gums to its portfolio and integrating seven regional plants and nine application centers across the Asia-Pacific.
The combined entity can cross-sell hydrocolloid blends and offer technical formulation support, potentially raising competitive pressure on regional guar processors. Syensqo’s Sustainable Guar Initiative, launched with L’Oréal, Procter & Gamble, and Henkel in 2025, sets a precedent for blockchain-based traceability that could split the market into commodity and certified supply streams. Processors that adopt transparent sourcing may command price premiums of 5-10% in cosmetics and premium foods.
Market Opportunities and Future Outlook
A key whitespace in the market is the development of institutional tools that reduce the impact of monsoon-driven price volatility on procurement and contracting across food, feed, and industrial uses. In July 2026, NCDEX announced the launch of guar korma futures, effective July 24, 2026, which creates a regulated hedging mechanism for exporters, processors, and animal feed manufacturers. The contract adds price-discovery and risk-management infrastructure for a crop that has historically relied on spot purchases, supporting longer-duration contracting.
Product and process innovation also creates room for value-added demand beyond traditional oilfield-linked cycles. Research momentum around improved cultivation practices, including optimized irrigation and nutrient management under drip systems, complements experimental applications such as moisture-responsive guar gum-based hydrogels and controlled-release delivery systems tied to climate-smart agriculture themes in arid regions. In parallel, diversification in feed and ingredients remains an opportunity, with guar korma positioned as a high-protein vegetable meal used as an alternative protein component in certain rations, broadening utilization pathways alongside clean-label food and personal-care formulations that favor natural rheology modifiers and traceable supply programs.
Recent Industry Developments in Asia-Pacific Guar Market
- July 2026: National Commodity and Derivatives Exchange (NCDEX) announced the launch of guar korma futures contracts effective July 24, 2026, creating a regulated hedging instrument for processors, exporters, and feed users. The announcement adds price-discovery and risk-management infrastructure to a value chain that has been exposed to monsoon-driven volatility and spot-market procurement. It also supports longer-tenor contracting for value-added derivatives such as korma used in feed formulations.
- January 2026: Rantec Corporation published its guar market update highlighting tight supply conditions and continued sensitivity of guar prices to availability in the Rajasthan supply cluster. The update underscored how lean inventories and procurement uncertainty can translate into sudden cost increases for downstream users that depend on consistent viscosity performance. Such market signals encourage buyers to diversify sourcing relationships and tighten quality and inventory planning.
- August 2025: South Asia Biotechnology Centre (SABC) launched the Sustainable Guar Initiative in Rajasthan with Jodhpur-based processing partners and local Farmer Producer Organizations (including Agronaut FPO and Jikaka FPO). The program focused on improving cultivation practices and quality consistency at the farm level, addressing a bottleneck for premium food, cosmetics, and other applications requiring tighter specifications. This coordinated upstream intervention improves processor access to better raw material and supports traceability-linked commercialization.


Asia-Pacific Guar Market Report Scope and Research Methodology
Market Definition and Coverage
For this report, the market is defined as the value of guar and guar-derived ingredients sold for end-use consumption across Asia Pacific, tracked in USD and supported with volume context in metric tons.
Scope exclusions: It excludes guar cultivation inputs and farm-level services, and it does not count end-products where guar is only a minor additive that cannot be reasonably valued.
Segments Covered in This Report
- By Geography
- China
- Production Analysis (Area Harvested, Yield, and Production Volume)
- Consumption Analysis (Consumption Value and Volume)
- Import Market Analysis (Import Value, Volume, and Key Supplying Markets)
- Export Market Analysis (Export Value, Volume, and Key Destination Markets)
- Wholesale Price Trend Analysis and Forecast
- Regulatory Framework
- List of Key Players
- Logistics and Infrastructure
- Seasonality Analysis
- Australia
- Production Analysis (Area Harvested, Yield, and Production Volume)
- Consumption Analysis (Consumption Value and Volume)
- Import Market Analysis (Import Value, Volume, and Key Supplying Markets)
- Export Market Analysis (Export Value, Volume, and Key Destination Markets)
- Wholesale Price Trend Analysis and Forecast
- Regulatory Framework
- List of Key Players
- Logistics and Infrastructure
- Seasonality Analysis
- India
- Production Analysis (Area Harvested, Yield, and Production Volume)
- Consumption Analysis (Consumption Value and Volume)
- Import Market Analysis (Import Value, Volume, and Key Supplying Markets)
- Export Market Analysis (Export Value, Volume, and Key Destination Markets)
- Wholesale Price Trend Analysis and Forecast
- Regulatory Framework
- List of Key Players
- Logistics and Infrastructure
- Seasonality Analysis
- Japan
- Production Analysis (Area Harvested, Yield, and Production Volume)
- Consumption Analysis (Consumption Value and Volume)
- Import Market Analysis (Import Value, Volume, and Key Supplying Markets)
- Export Market Analysis (Export Value, Volume, and Key Destination Markets)
- Wholesale Price Trend Analysis and Forecast
- Regulatory Framework
- List of Key Players
- Logistics and Infrastructure
- Seasonality Analysis
- China
Data Validation & Update Cycle
Outputs were validated through triangulation across independent signals, so the value trend, the implied volume trend, and the price path had to make sense together. Large variances triggered a second pass that rechecked trade direction, unit conversions, and the timing of currency rates, and then follow-up outreach was done when a driver could not be explained.
Before sign-off, the model and assumptions go through multiple analyst reviews so calculation logic and scope consistency are confirmed. The report is refreshed annually, and interim updates are made when there are material changes such as unusual crop outcomes, sudden trade restrictions, or sharp price shocks. Right before delivery, a fresh review pass is completed so clients receive the latest updated view.
How Mordor Intelligence's Asia-Pacific Guar Market Size Compares to Other Published Estimates
Published market sizes for Asia Pacific guar often do not match because sources mix different product definitions, pick different base years, and apply different price logic when crop cycles swing. Another common reason is that some studies emphasize a faster or slower demand recovery path, which then changes the implied volume and price trajectory.
Guar gum-only reporting is a frequent reason for a higher number, and that item sits outside Mordor Intelligence's scope when it is presented as a standalone ingredient market rather than part of the broader guar value tracked with trade and wholesale price checks.
Benchmark comparison
| Source | Market Size | Gaps in Research Methodology |
|---|---|---|
| Mordor Intelligence | USD 245.52 M (2025) | |
| Industry Publisher A | USD 288.04 M (2025) | Often centers on guar gum revenue and grade-led reporting, which can pull in downstream value and a wider set of gum applications than a guar market definition tied to regional trade and wholesale price signals. |
| Research Publisher B | USD 205.88 M (2024) | Uses an earlier base year and a slower growth path, and it can understate the rebound when trade volumes and wholesale prices normalize after crop-driven volatility. |
Taken together, the spread mainly comes from what gets counted as the core product set and how price and year selection are handled during volatile seasons. By anchoring the estimate to production and net trade direction, and then cross-checking the value build with wholesale pricing, our figure stays traceable to simple inputs that can be repeated and audited.


Key Questions Answered in the Report
How large is the Asia-Pacific guar market in 2026?
The Asia-Pacific guar market size is estimated at USD 258.46 million in 2026.
What is the forecast growth rate through 2031?
The market is projected to register a 5.27% CAGR from 2026 to 2031.
Which country contributes the most supply?
India accounts for 71.20% of regional value in 2025, reflecting its dominant production in Rajasthan.
Why is Australia considered the fastest-growing country segment?
Government incentives for drought-resilient crops and Commonwealth Scientific and Industrial Research Organisation (CSIRO) agronomy trials support a 7.60% CAGR through 2031.
What drives rising guar usage in premium dairy and plant-based beverages?
Consumers favor clean-label formulations, and guar provides efficient mouthfeel and stability at low inclusion rates.
How does the Tate and Lyle-CP Kelco deal affect market competition?
The combined entity offers broader hydrocolloid portfolios and application support, intensifying competition for regional processors.
Page last updated on:






